Don’t invest unless you’re prepared to lose all the money you invest. This is a high-risk investment and you are unlikely to be protected if something goes wrong. Take 2 minutes to learn more
Market Analysis – September 22
US Oil (WTI) regains bullish sharpness. The bulls have reemerged on the US Oil (WTI) scene with a renewed sense of determination. After a period of consolidation and correction, the price corrected lower and failed to breach the 90.160 key level.
The bulls are once again flexing their muscles. This pattern is reminiscent of mid-July. The price broke through the 77.750 market level, only to face resistance at the 85.160 significant zone. Following this resistance, the price corrected lower, ultimately reaching the 77.750 key level.
US Oil (WTI) Key Levels
Resistance Levels: 90.160, 85.160
Support Levels: 77.750, 66.550
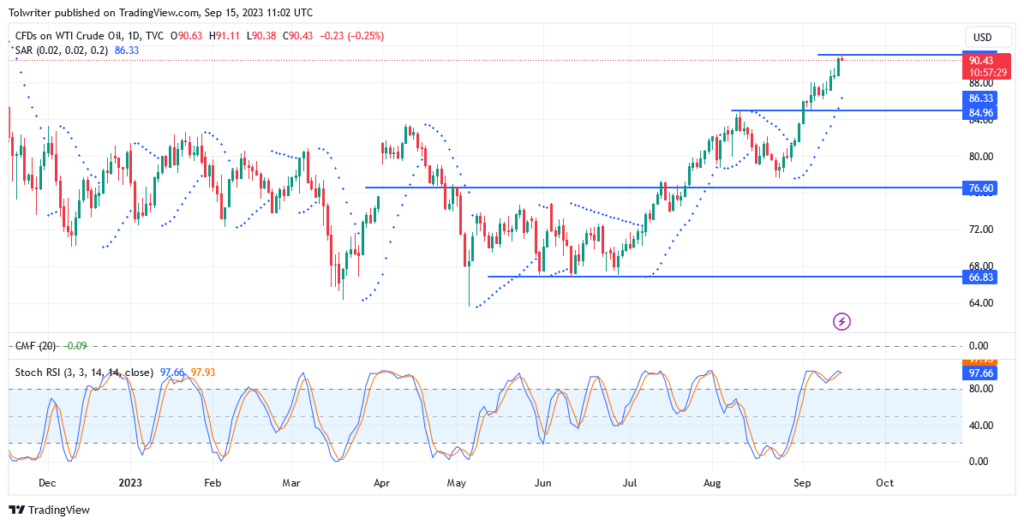
US Oil (WTI) Long-Term Trend: Bullish
It’s worth noting that corrections like these often serve as catalysts for further bullish progress. Investors taking profits and closing out positions create an environment where bulls can regroup and push the price higher. This retracement allows for a healthier and more sustainable upward trend.
While the buyers have started to regain their rhythm and push the oil price higher, there are challenges on the horizon. The Relative Strength Index (RSI) indicates a potential sell signal, with the price showing signs of being overbought. This suggests that the bulls may have lost some of their strength to propel the price forward.
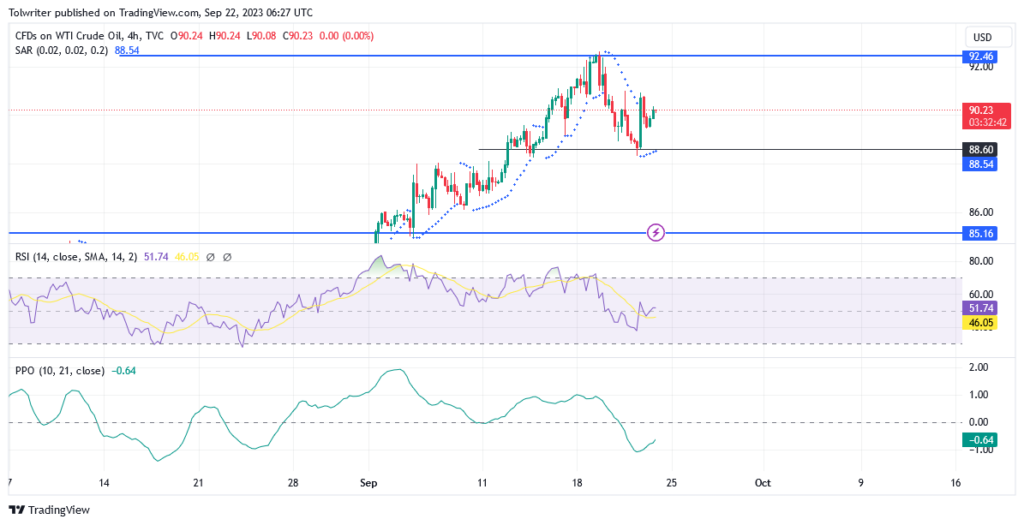
US Oil (WTI) Short-Term Trend: Bullish
On the 4-hour chart, the Price Oscillator Indicator is on the rise. Should it cross the 0.00 level, it would signify a bullish acceleration, potentially signaling a resurgence of buying pressure. Additionally, the Parabolic SAR (Stop and Reversed) indicator is locked in for a bullish reversal. It further indicates that the bulls are regaining control.
You can purchase Lucky Block – Guide, Tips & Insights | Learn 2 Trade here. Buy LBLOCK
Note: Learn2.trade is not a financial advisor. Do your research before investing your funds in any financial asset or presented product or event. We are not responsible for your investing results.
- Broker
- Min Deposit
- Score
- Visit Broker

- Award-winning Cryptocurrency trading platform
- $100 minimum deposit,
- FCA & Cysec regulated

- 20% welcome bonus of upto $10,000
- Minimum deposit $100
- Verify your account before the bonus is credited
- Fund Moneta Markets account with a minimum of $250
- Opt in using the form to claim your 50% deposit bonus
Learn to Trade
Never Miss A Trade Again

Signal Notification
Real-time signal notifications whenever a signal is opened, closes or Updated

Get Alerts
Immediate alerts to your email and mobile phone.

Entry Price Levels
Entry price level for every signal Just choose one of our Top Brokers in the list above to get all this free.