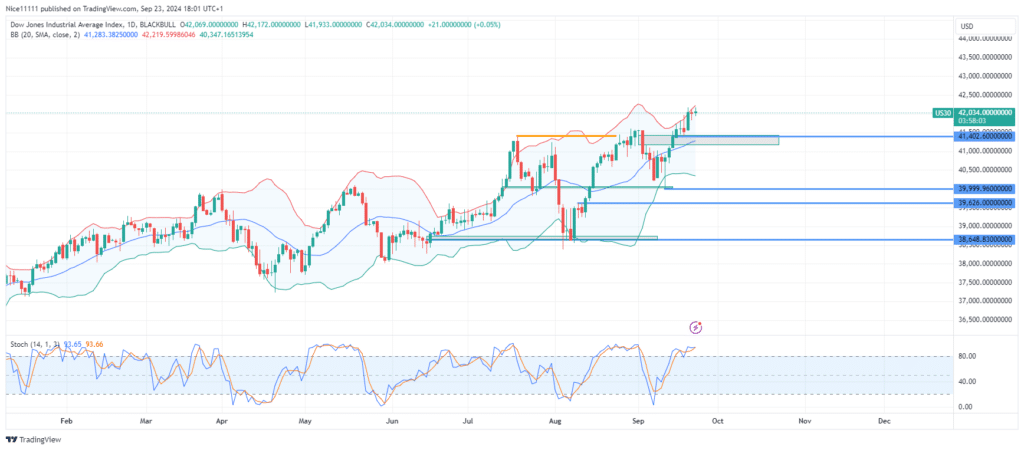
US 30 index buyers continue to dominate, as the index maintains a steady upward momentum. Throughout September, the price has surged beyond the previous month’s high, signaling a robust bullish movement. The index has broken through the key swing high of 41,402.0, highlighting an impressive rally.
US 30 index has enjoyed a remarkable year, achieving a 23.69% annual gain. After surpassing last month’s high at 41,400.0, the price briefly pulled back to find support, dipping into a volume imbalance zone from July. A bullish hammer candle emerged from this region, reigniting the upward trend.
The Stochastic indicator confirmed that the market was oversold after testing the volume imbalance, which led to a sharp price reversal. This reversal coincided with a test of the lower Bollinger Band, which acted as support, driving the aggressive bullish displacement.
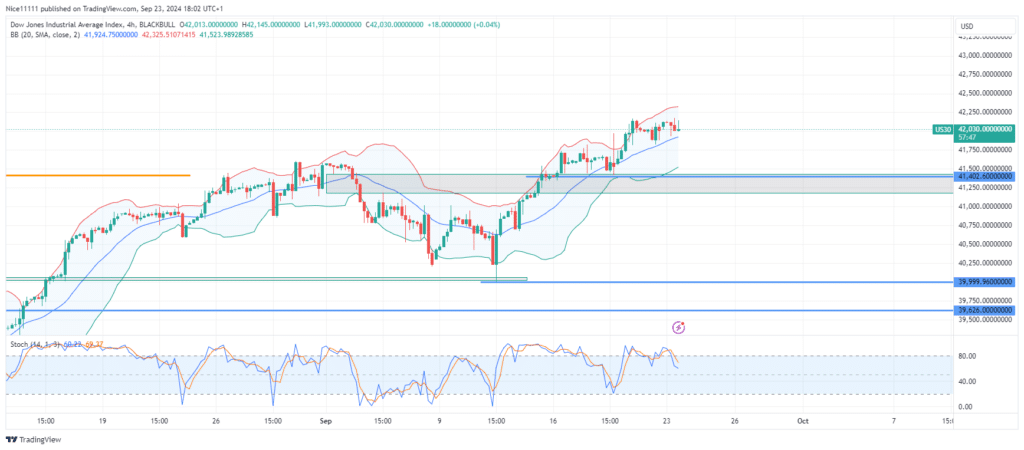
US 30 Short-Term Trend: Bullish
On the 4-hour chart, the US 30 index shows a strong bullish market structure. While the price is currently moving sideways, signaling a potential pullback, the Stochastic indicator shows overbought conditions. Traders should watch for a breakout from this consolidation, in line with the market’s momentum, which could generate reliable forex signals.
Note: Learn2.trade is not a financial advisor. Do your research before investing your funds in any financial asset, product, or event. We are not responsible for your investment results.
Trade on MT4 with Leverage up to 1:500! Trade on MT4 with Leverage up to 1:500!
X
We use cookies to ensure that we give you the best experience on our website. If you continue to use this site we will assume that you are happy with it.