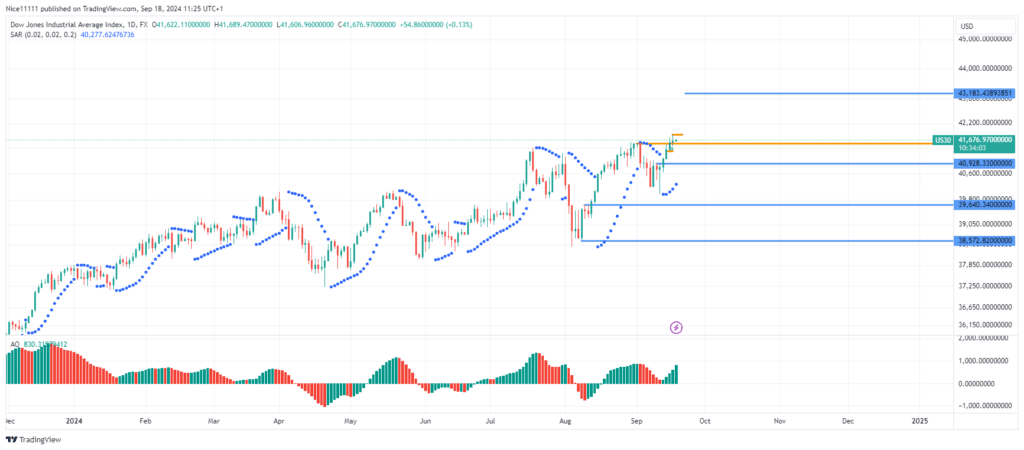
The US 30 index has maintained a bullish institutional order flow since the beginning of the year. Recently, the price surged above the previous high of 41,677.0, marking a bullish break of structure (BOS) on the daily chart. This BOS reinforces the upward trend, confirming the bullish market sentiment.
In September, after reaching a new high of 41,677.0, US 30 index experienced a brief pullback. The price dipped below 40,000.0, where inefficient trading zones, denoted by fair value gaps, became evident.
However, a bullish hammer candle signaled the end of this retracement, paving the way for the resumption of the uptrend. The Parabolic SAR (Stop and Reverse) points have aligned below the daily candles, further confirming the renewed bullish momentum. In addition, the Awesome Oscillator is showing increasing green bars, indicating rising bullish momentum.
US 30 Short-term Trend: Bullish
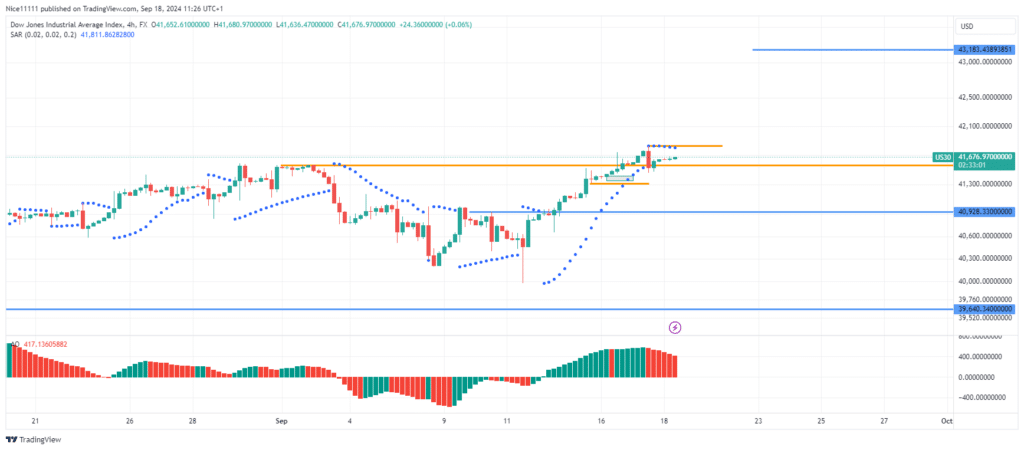
On the 4-hour chart, the market has paused for a retracement, with the price now retesting the previous high of 41,626.0 as potential support. A fair value gap lies within the last bullish displacement that led to the BOS on the daily chart. Further retracement may occur, but the price is expected to rally toward the 42,000 mark in the near term. Crypto signals will reflect this market dynamics.
Note: Learn2.trade is not a financial advisor. Do your research before investing your funds in any financial asset, product, or event. We are not responsible for your investment results.
Trade on MT4 with Leverage up to 1:500! Trade on MT4 with Leverage up to 1:500!
X
We use cookies to ensure that we give you the best experience on our website. If you continue to use this site we will assume that you are happy with it.