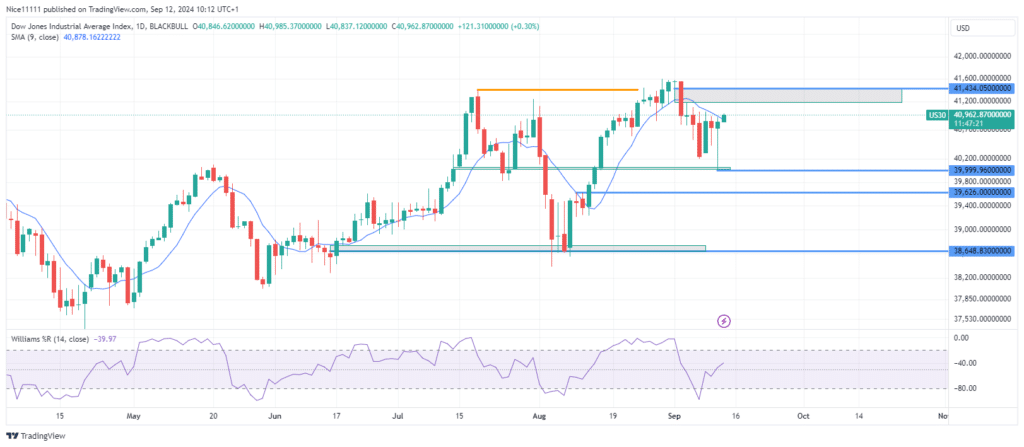
The US 30 index has completed its correction phase, as seen by a significant rebound in price action. A prominent bullish hammer candle on the daily chart indicates strong potential for upward movement in the coming sessions.
In August, the US 30 index broke above the key resistance level at 41,434.0, but the breakout was brief, leading to a notable price decline. The Williams Percent Range had already indicated that the market was overbought, aligning with the subsequent correction. This pullback, however, occurred gradually, confirming that the price was in a correction phase rather than a reversal.
As the index approached the volume imbalance at 39,999.0 (formed around mid-July), it quickly rejected this zone, leading to the formation of a strong bullish hammer candle. This rejection from a critical demand area suggests the market is primed for a potential surge. The Williams Percent Range also indicated an oversold condition, reinforcing the likelihood of a bullish price recovery.
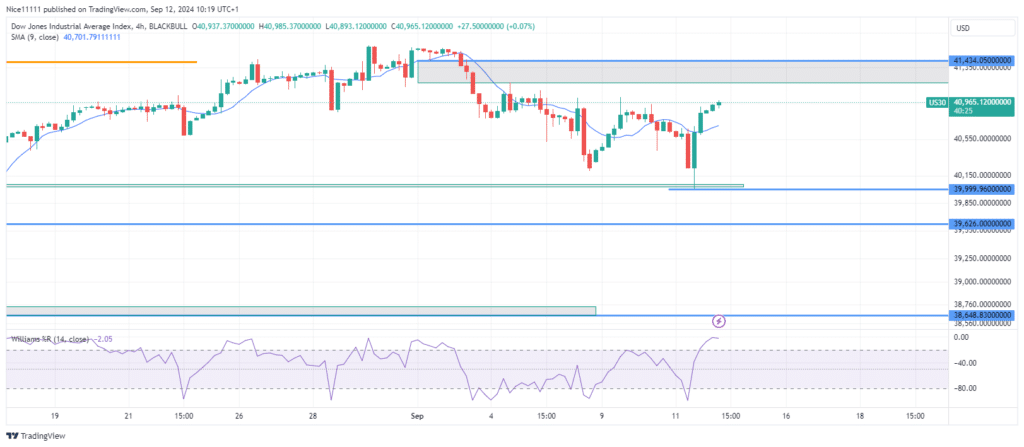
US 30 Short-Term Trend: Bullish
On the lower timeframes, the previous bearish order block has been invalidated. The price has moved above the 9-period Moving Average, confirming a short-term bullish trend. The price is now advancing towards a fair value gap just below 41,434.0. All indications point to a continuation of the upward movement, with a key focus on the 41,434.0 resistance level. Traders following reliable forex signals may find this setup promising as the market trends upward.
Note: Learn2.trade is not a financial advisor. Do your research before investing your funds in any financial asset, product, or event. We are not responsible for your investment results.
Trade on MT4 with Leverage up to 1:500! Trade on MT4 with Leverage up to 1:500!
X
We use cookies to ensure that we give you the best experience on our website. If you continue to use this site we will assume that you are happy with it.