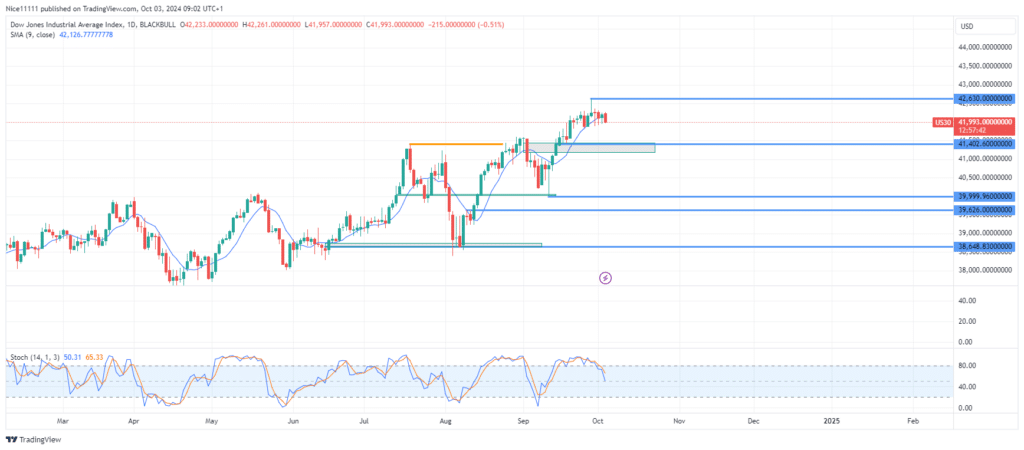
The US 30 index is displaying clear indications of a potential retracement after its recent bullish rise from 39,999.0, driven by a pullback to a fair value gap on the daily chart. Buyers now appear to be losing strength, suggesting a possible shift in the market trend.
In September, the Stochastic indicator reached the oversold region, halting the previous pullback. This created the conditions for the US 30 bullish trend to resume, highlighted by a hammer candle at 39,999.0. From there, the price moved upward, reaching 42,630.0.
However, recent price movement has become more stagnant, with smaller candles forming sideways, which points to waning bullish momentum. An inverted hammer at 42,630.0 signals a possible decline, further supported by the Stochastic indicator shifting away from the overbought region as prices start to fall.
US 30 Short-term Trend: Bullish
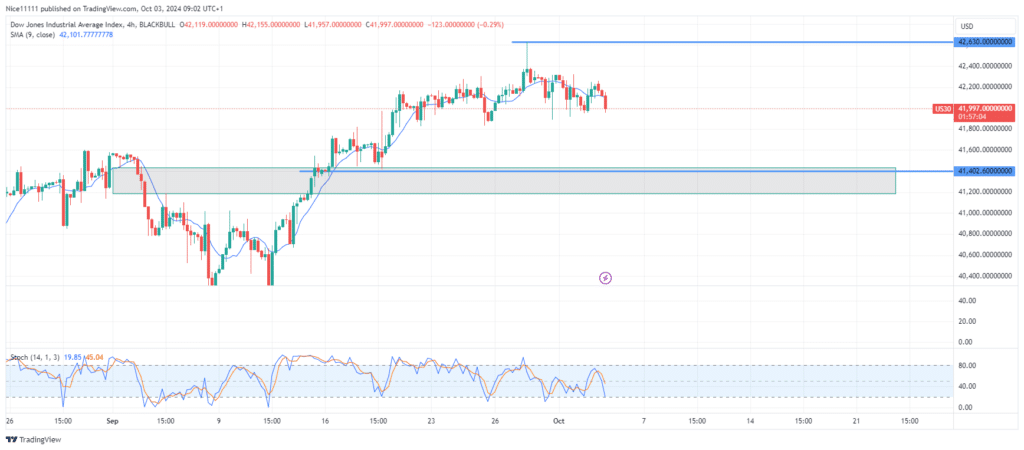
On lower timeframes, the price action has formed three falling peaks, indicating a potential decline. It is advisable to wait for confirmation of trend resumption before entering long positions to ensure a higher chance of success. Engaging in counter-trend trades at this stage carries heightened risk, even with favorable forex signals.
Note: Learn2.trade is not a financial advisor. Do your research before investing your funds in any financial asset, product, or event. We are not responsible for your investment results.
Trade on MT4 with Leverage up to 1:500! Trade on MT4 with Leverage up to 1:500!
X
We use cookies to ensure that we give you the best experience on our website. If you continue to use this site we will assume that you are happy with it.