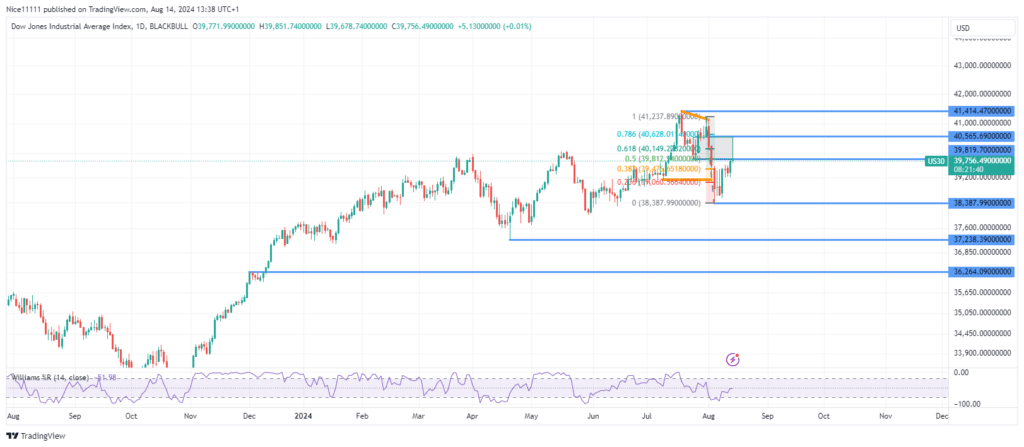
The US 30 index has exhibited a bearish shift in market structure following a drop below the demand level of 39,076. The price is now retracing to a bearish breaker block, which is currently acting as resistance.
In early August, the US 30 formed a failure swing, signaling market weakness and a potential trend change. This led to a decline down to 38,387.0, where the descent temporarily paused.
The market is now undergoing a correction after a significant downward movement. This correction is characterized by a sluggish upward trend. The Williams Percent Range indicated an oversold condition just before this correction began.
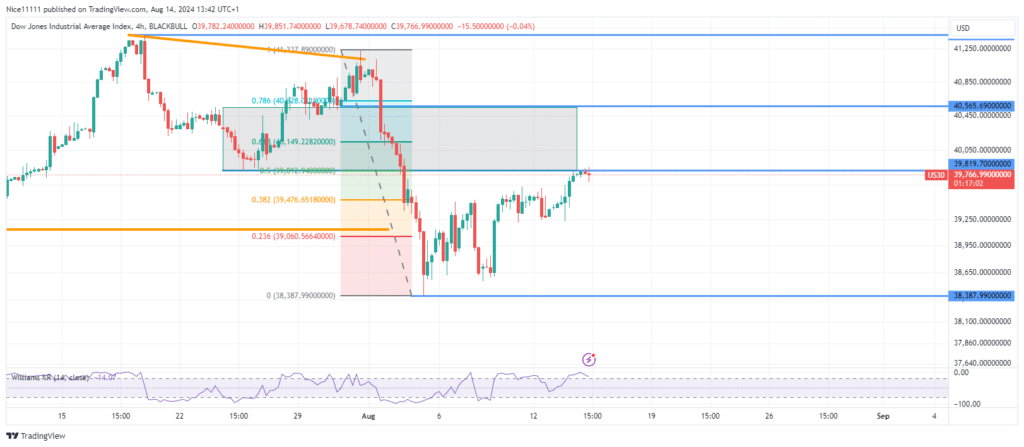
US 30 Short-Term Trend: Bullish
The current retracement on the daily chart suggests a bullish trend on the 4-hour timeframe. However, traders should remain cautious as this bullish trend on the lower timeframe has met resistance at a higher timeframe premium array. The Williams Percent Range on the 4-hour chart shows overbought conditions, indicating potential for a bearish reversal. It is advisable to monitor for signs of a bearish shift on the lower timeframe to generate the best forex signals.
Note: Learn2.trade is not a financial advisor. Do your research before investing your funds in any financial asset, product, or event. We are not responsible for your investment results.
Trade on MT4 with Leverage up to 1:500! Trade on MT4 with Leverage up to 1:500!
X
We use cookies to ensure that we give you the best experience on our website. If you continue to use this site we will assume that you are happy with it.