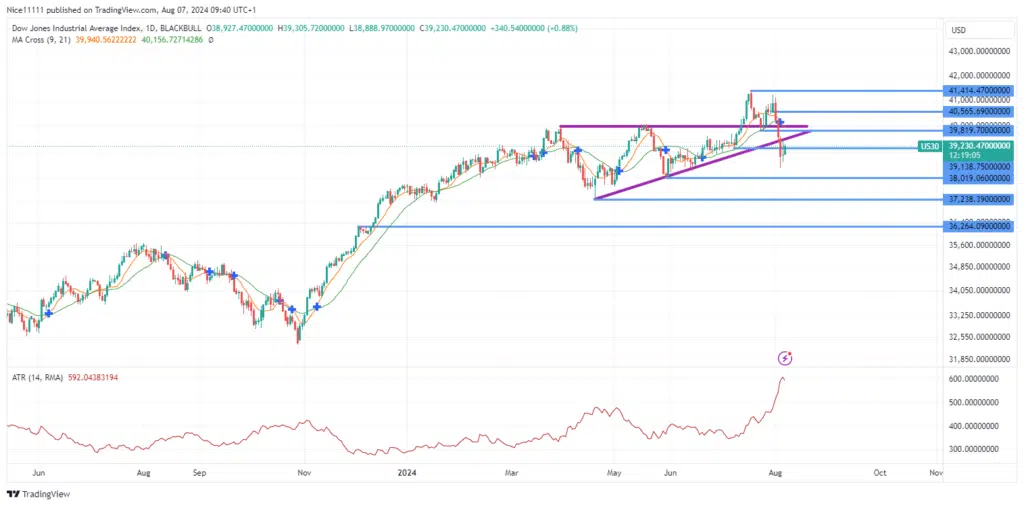
US 30 index, in recent years, has demonstrated its highest volatility since the beginning of the year. The appearance of large-range candles has invalidated the previous bullish order block, signaling a reversal into a bearish market trend.
US 30 Key Levels:
Demand Levels: 38018.0, 37238.0, 36264.0 Supply Levels: 39819.0, 40565.0, 41414.0 US 30 Long-Term Trend: Bearish
The US 30 market previously experienced a steady price rise until it reached the resistance level at 38919.0. This resistance level twice prevented further ascent, leading to the formation of equal highs and higher lows, characteristic of an ascending triangle pattern. A bullish breakout occurred in July.
However, following the breakout, the price retraced to test the triangle’s border, forming a new high that was lower than the preceding peak. This lower high, known as a failed high, indicated weakness in the bullish trend. Consequently, the market saw a significant decline. The bullish order block failed to sustain the price amid intense volatility. This bearish sentiment was further highlighted by the appearance of three black crows during the price crash, reflecting strong bearish momentum.
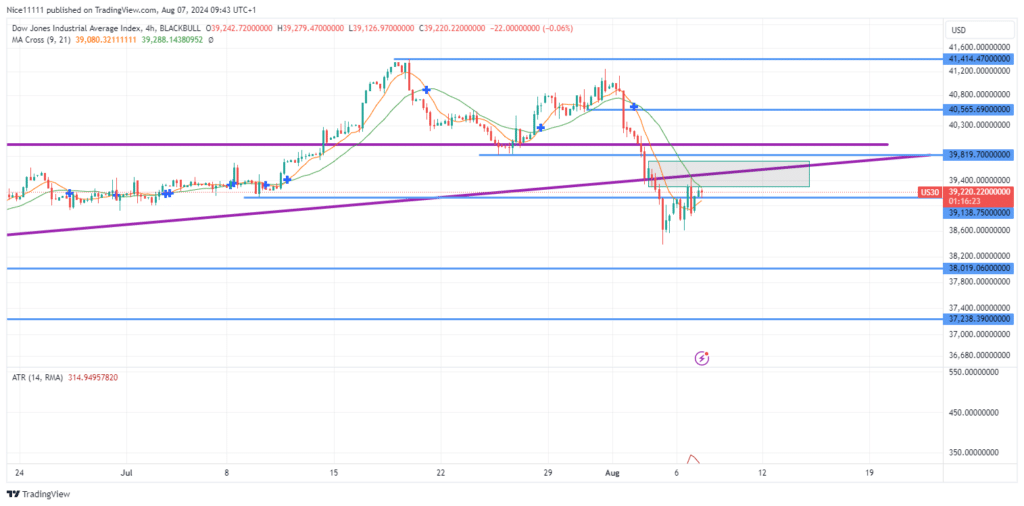
US 30 Short-Term Trend: Bearish
In the short term, the price has retraced to a bearish order block on the 4-hour timeframe, specifically at the level of 39320.0. This pullback is expected to assist sellers in generating short forex signals, aligning with the current trend shift.
Note: Learn2.trade is not a financial advisor. Do your research before investing your funds in any financial asset, product, or event. We are not responsible for your investment results.
Trade on MT4 with Leverage up to 1:500! Trade on MT4 with Leverage up to 1:500!
X
We use cookies to ensure that we give you the best experience on our website. If you continue to use this site we will assume that you are happy with it.