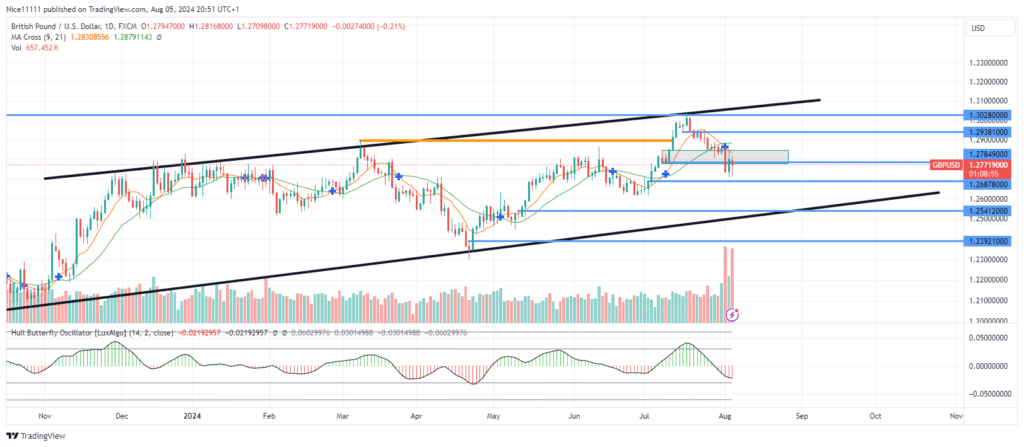
GBPUSD price has responded to the test of the resistance boundary of the parallel channel on the daily chart. This test has prompted a surge of selling activity, resulting in a decline in price.
The current bullish trend for GBPUSD began with a price reversal in April when the bearish order block failed to contain the price on the daily chart. This uptrend has been supported by a bullish market structure, including tests of bullish order blocks.
The price test of the bullish order block at 1.2600 occurred when the Stochastic indicator was oversold, leading to a significant price surge toward the resistance boundary of the parallel channel. The ascent to this resistance created a bullish order block along the way. However, selling pressure intensified at the resistance boundary, with the Stochastic showing an overbought condition, which resulted in a dip below the bullish order block.
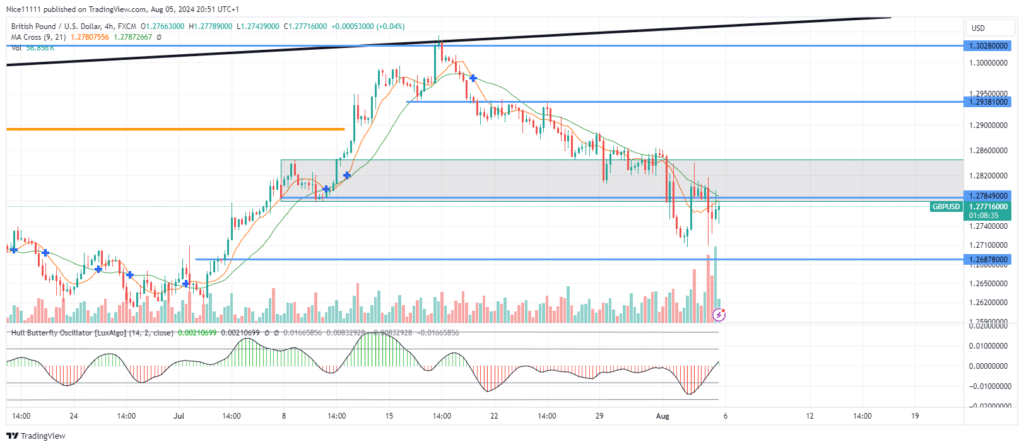
GBPUSD Short-Term Trend: Bearish
On the 4-hour chart, the market structure appears bearish. Although the overall trend on higher timeframes remains bullish, the bullish order block has been invalidated. It is prudent to wait for a clear bearish or bullish Break of Structure (BOS) before drawing definitive conclusions about the trend direction. Accurate crypto signals require confirmation through such structural breaks.
Note: Learn2.trade is not a financial advisor. Do your research before investing your funds in any financial asset, product, or event. We are not responsible for your investment results.
Trade on MT4 with Leverage up to 1:500! Trade on MT4 with Leverage up to 1:500!
X
We use cookies to ensure that we give you the best experience on our website. If you continue to use this site we will assume that you are happy with it.