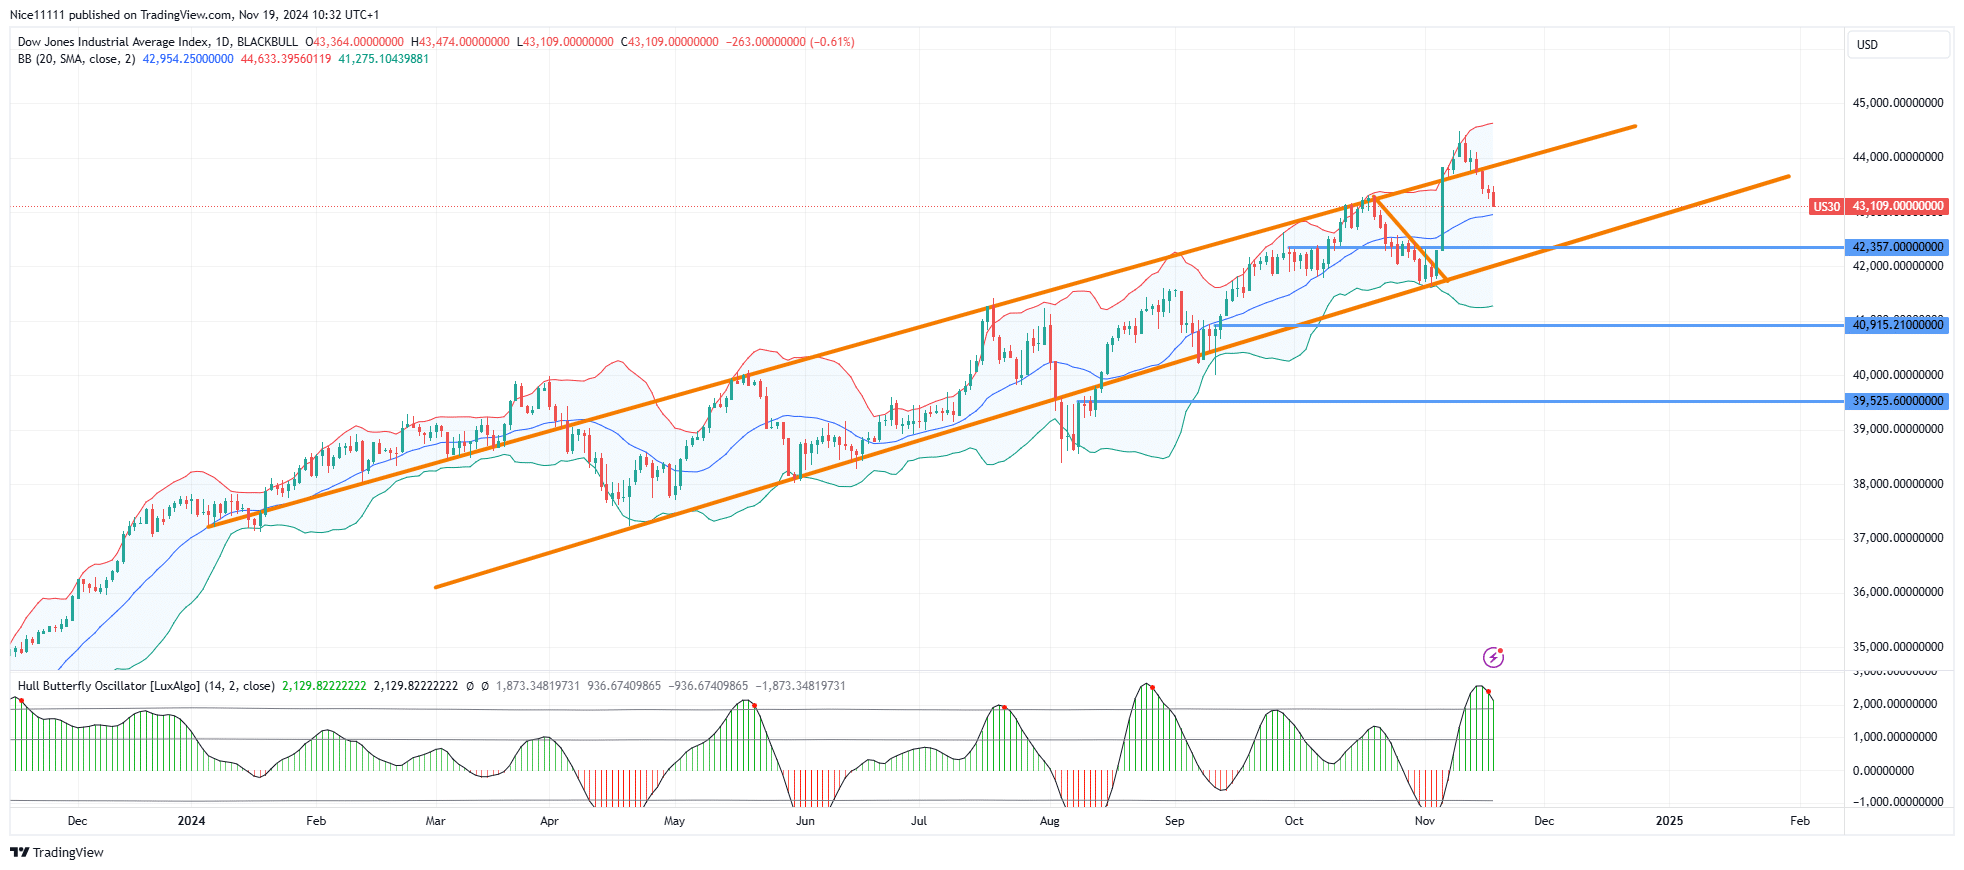
The US 30 has sustained its bullish momentum within a clearly defined parallel channel since the second quarter. The channel’s boundaries have proven highly reactive, with price action consistently respecting both resistance and support levels. Recently, the price breached the resistance boundary, only to reverse and fall back into the channel, signaling a false breakout.
After the false breakout, the price reached the upper Bollinger Band before experiencing a sharp decline. This movement was accompanied by a bullish exhaustion signal, confirmed by a red point appearing in the positive zone of the Hull Butterfly indicator.
The price is currently retracing toward the bullish order block at 42,000.0. This zone aligns with the lower boundary of the parallel channel, providing strong support. A potential surge from this level is expected, as it offers a favorable opportunity for the continuation of the bullish trend.
US 30 Short-Term Trend: Bullish
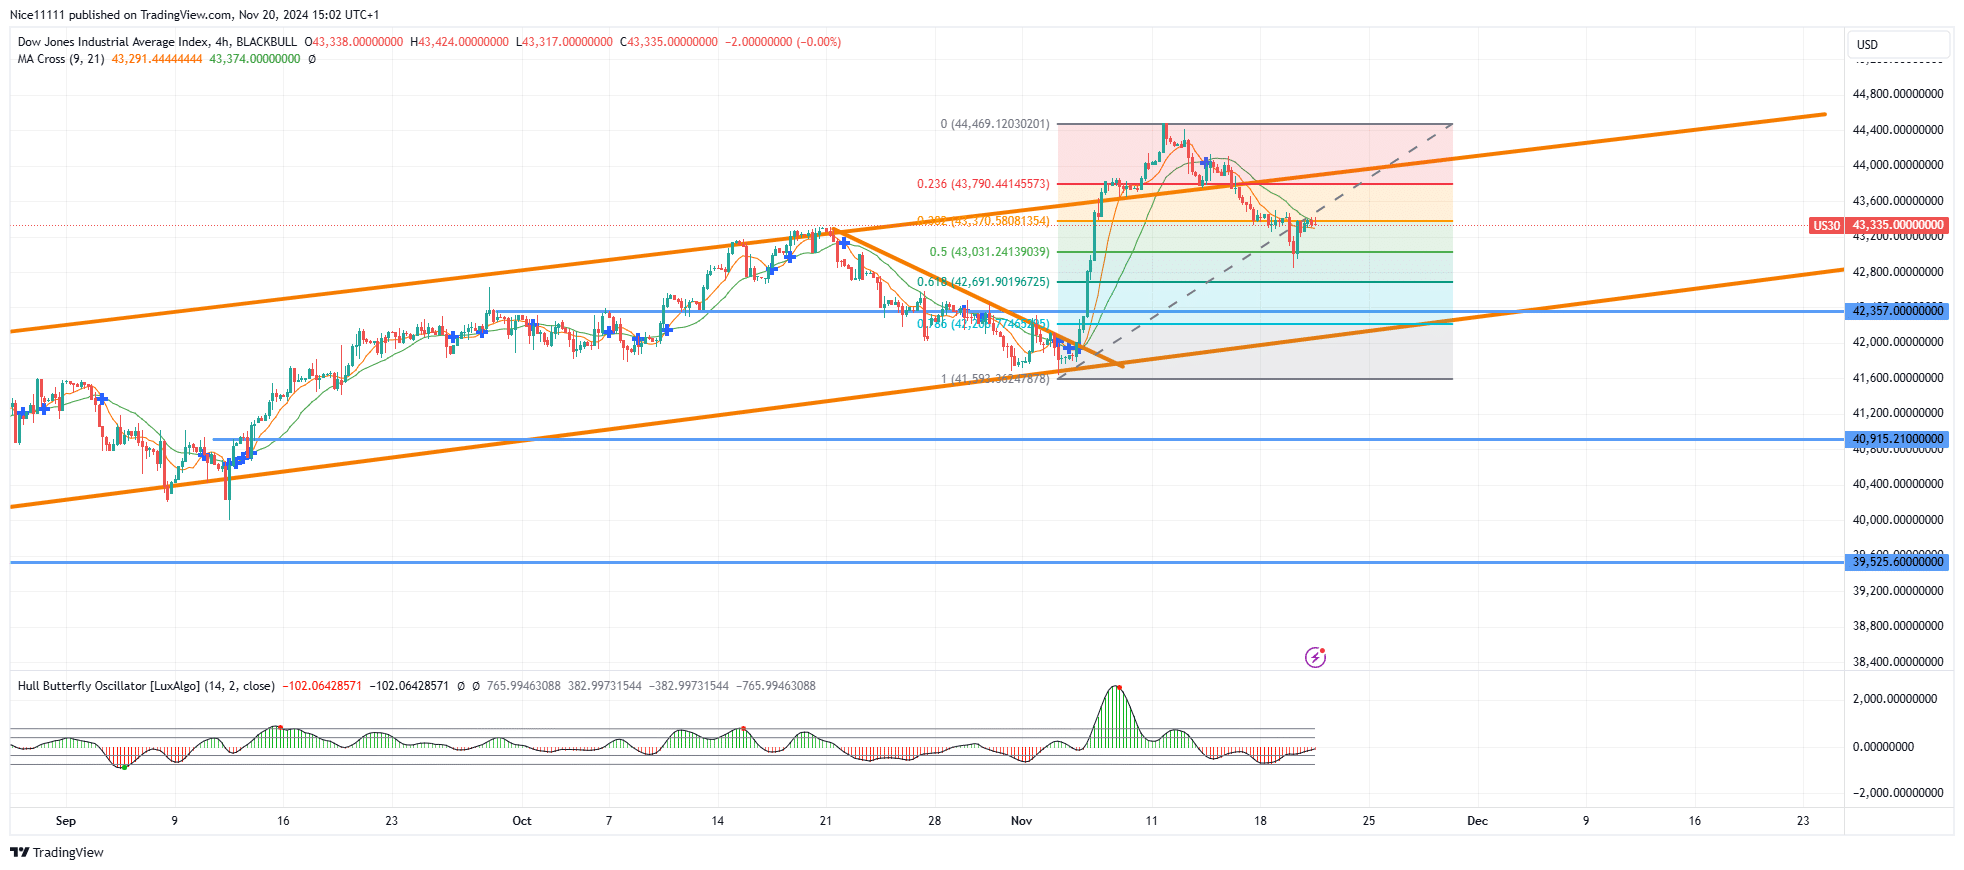
In lower timeframes, the market is temporarily bearish due to the ongoing pullback. However, the retracement has reached 50% of the bullish displacement range, a critical level often associated with reversals. Monitoring for a shift in market structure on these shorter timeframes is essential.
This technical correction increases the probability of a bullish resurgence in the near term, particularly for those following forex signals and related market dynamics.
Note: Learn2.trade is not a financial advisor. Do your research before investing your funds in any financial asset, product, or event. We are not responsible for your investment results.
Trade on MT4 with Leverage up to 1:500! Trade on MT4 with Leverage up to 1:500!
X
We use cookies to ensure that we give you the best experience on our website. If you continue to use this site we will assume that you are happy with it.