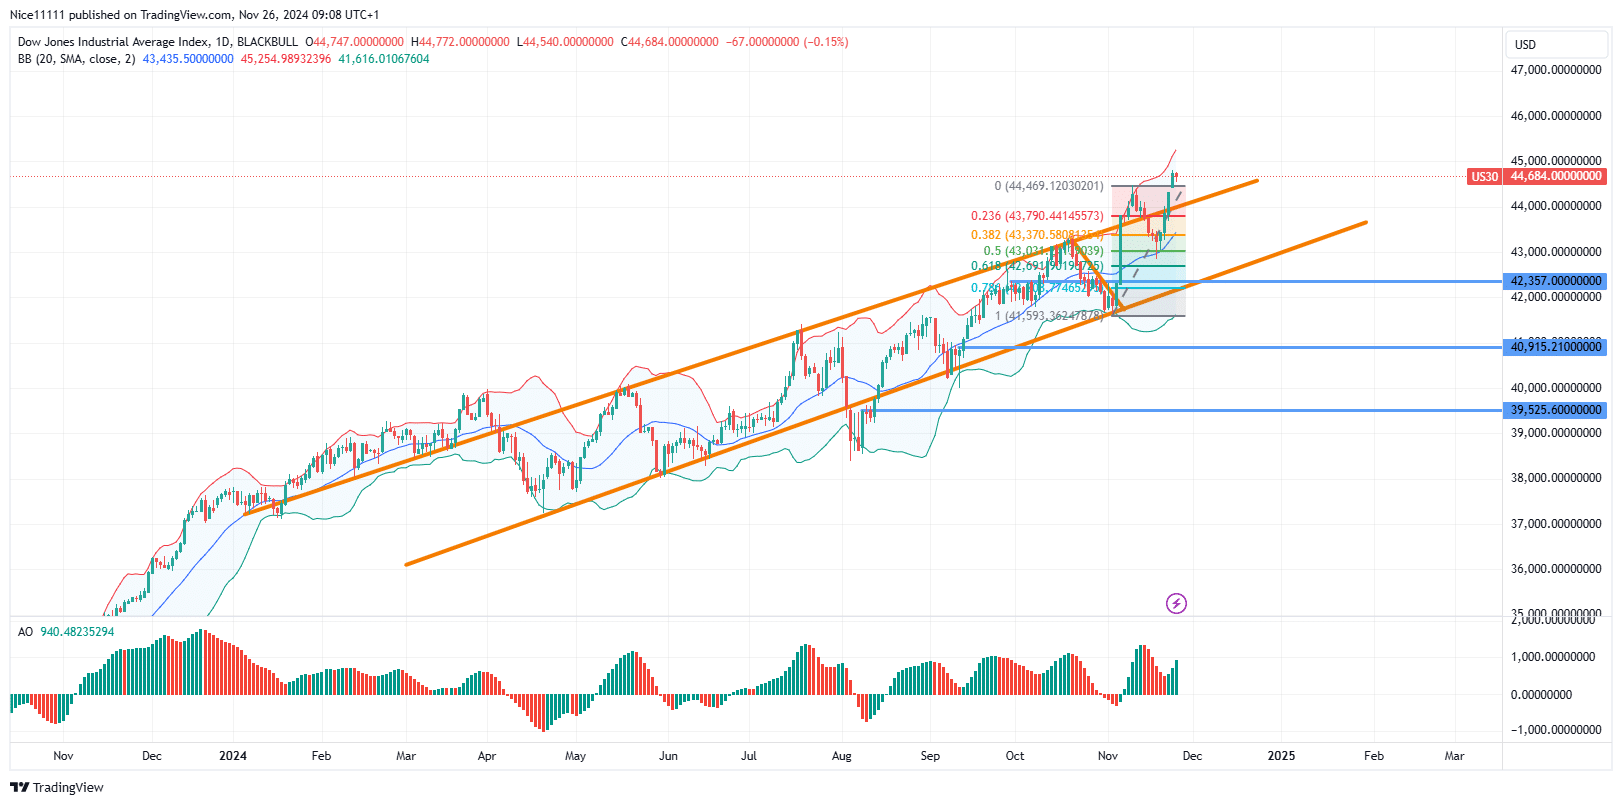
US 30 retraced after reaching a swing high at 44,469.0, pulling back to equilibrium at 50% of the previous bullish displacement range before resuming its uptrend. This movement has led to a new bullish Break of Structure (BOS) and an all-time high.
The major correction in October concluded after a successful test of the bullish trendline, which continues to act as support within the parallel channel. This test coincided with a touch on the lower Bollinger Band, indicating an oversold condition. This confluence triggered a significant price surge, breaking above the channel’s upper boundary.
Following the formation of a new all-time high in November, a retracement occurred. A hammer candle formed at the equilibrium of the prior bullish move, propelling the continuation of the uptrend. The daily chart also highlights a price gap, reinforcing the bullish momentum.
US 30 Short-Term Trend: Bullish
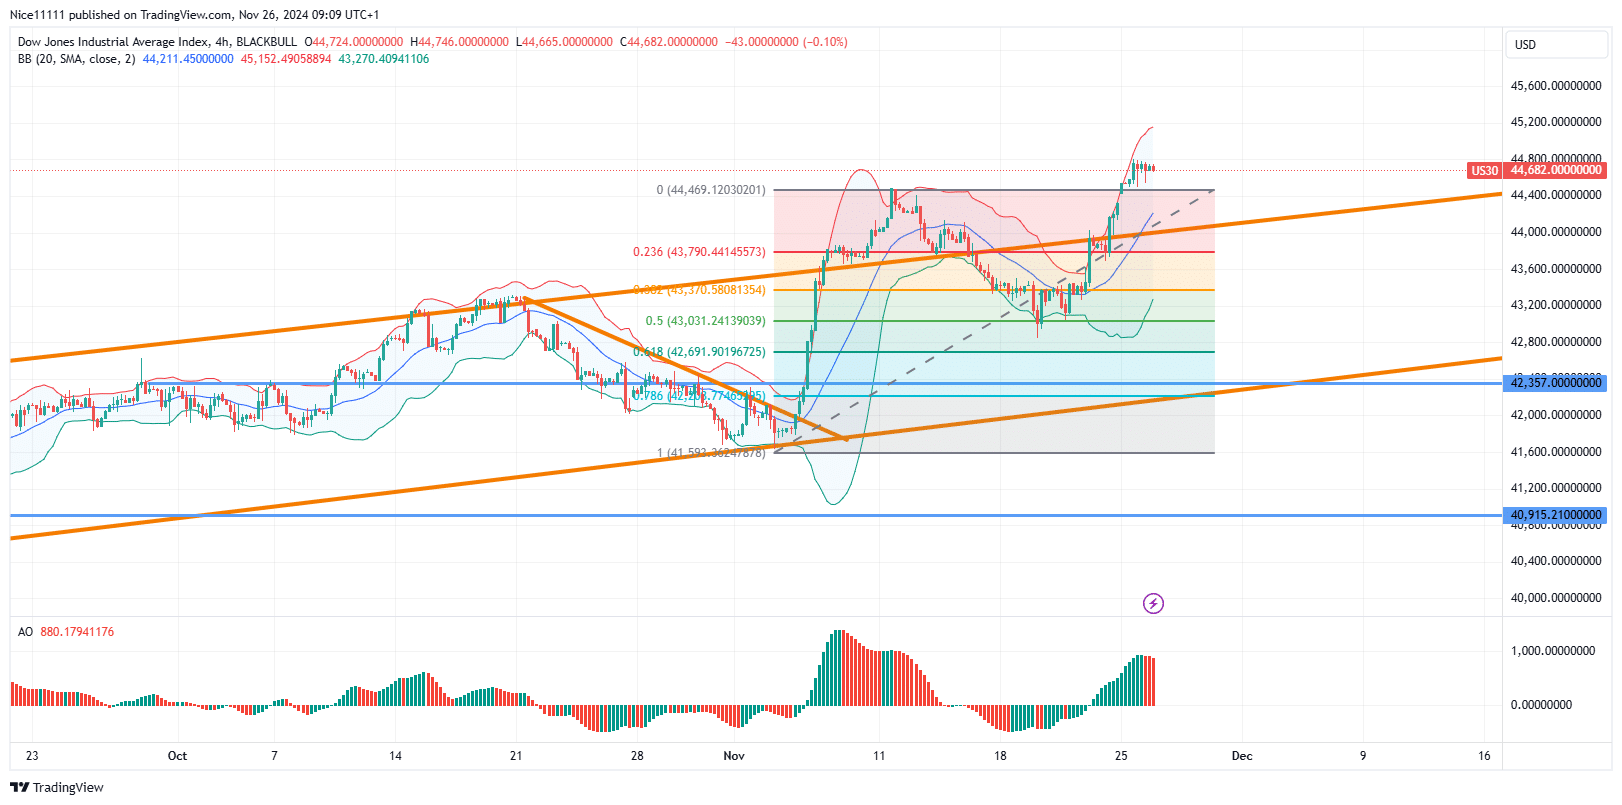
On shorter timeframes, the equilibrium level of the previous bullish displacement revealed a double-bottom pattern, confirming the correction’s completion and signaling the uptrend’s continuation. The price is now rallying toward 46,009.0, with bullish momentum backed by forex signals indicating further potential gains.
Note: Learn2.trade is not a financial advisor. Do your research before investing your funds in any financial asset, product, or event. We are not responsible for your investment results.
Trade on MT4 with Leverage up to 1:500! Trade on MT4 with Leverage up to 1:500!
X
We use cookies to ensure that we give you the best experience on our website. If you continue to use this site we will assume that you are happy with it.