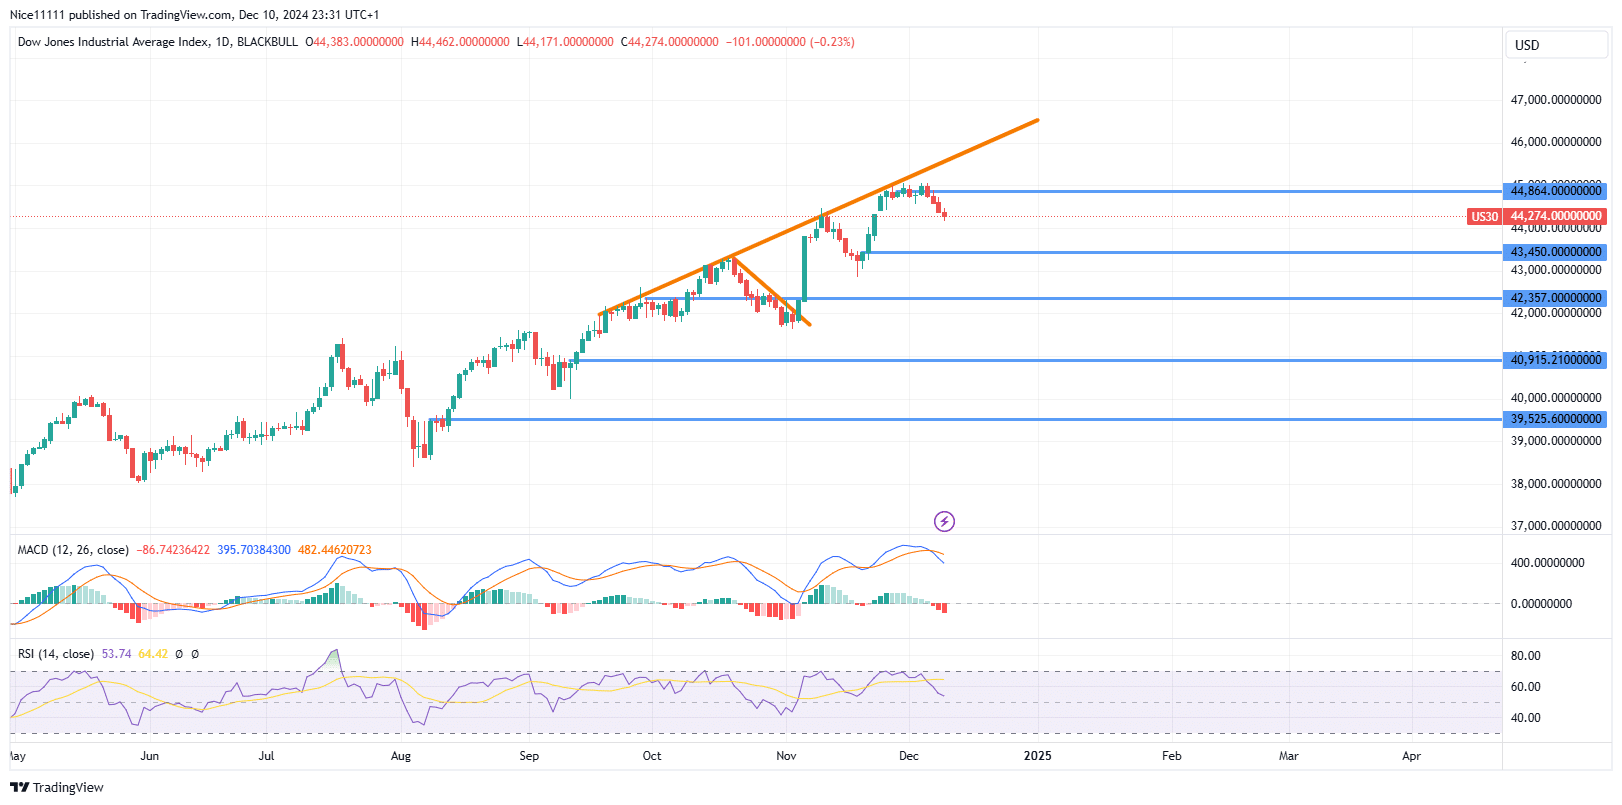
US 30 has undergone consecutive bearish sessions over recent days. Although the broader trend remains bullish, the alignment of successive down-close daily candles indicates the market has entered a corrective phase.
During this bullish phase, the momentum was strong, leading to noticeable price gaps. However, as the price approached the 44,864.0 level, the daily candles began consolidating sideways, suggesting exhaustion in the upward movement.
Technical indicators, including the MACD (Moving Average Convergence Divergence), highlight overbought conditions, a signal supported by the RSI (Relative Strength Index), which suggests a pullback is likely.
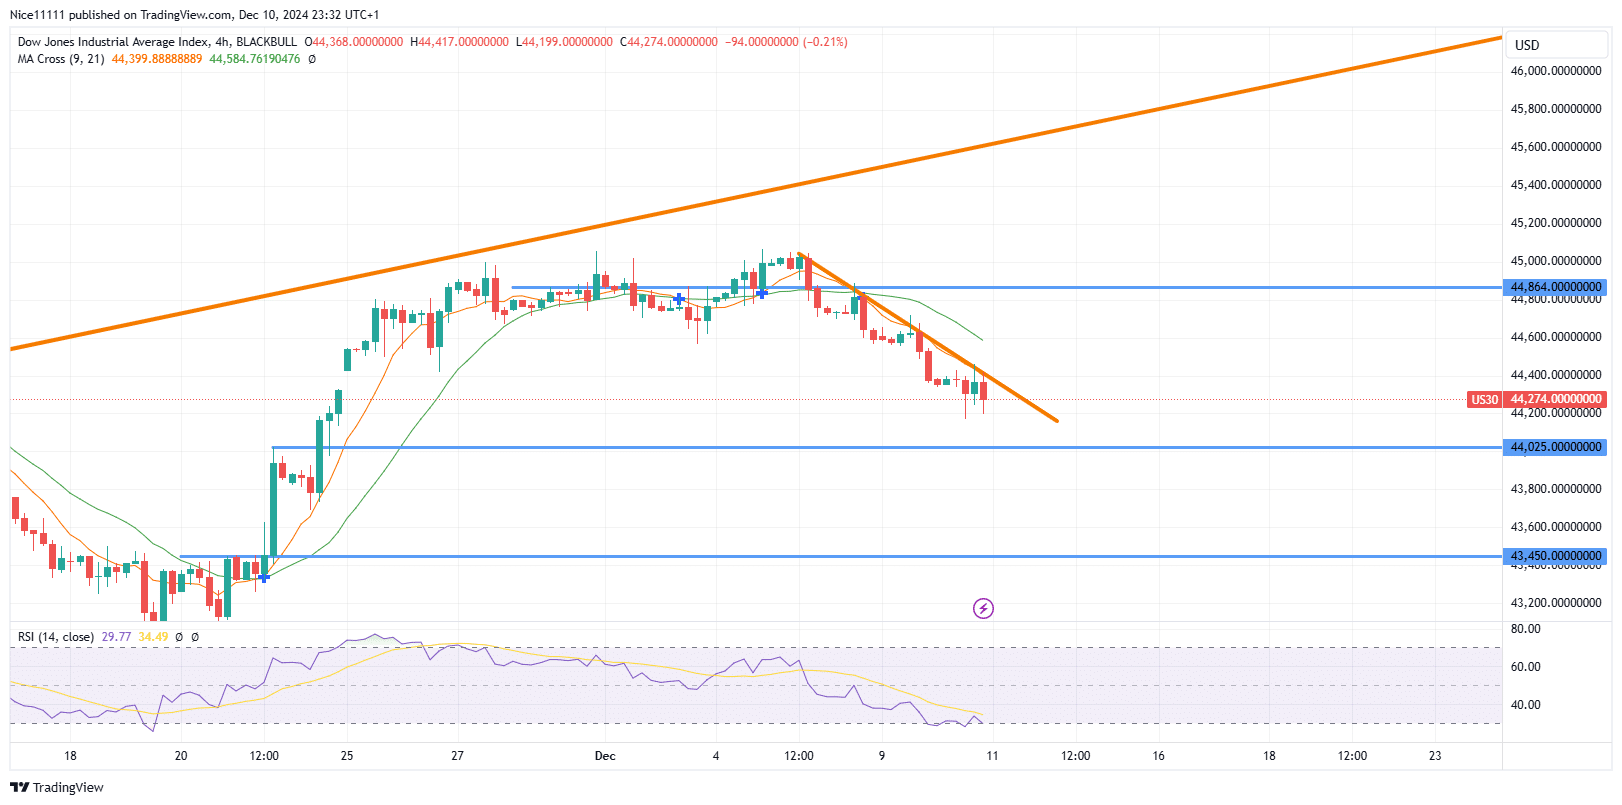
US 30 Short-Term Trend: Bearish
In lower timeframes, a clear bearish trend has emerged. Moving Averages currently sit above the price, indicating short-term selling pressure. The price is nearing a demand zone at 44,025.0 on lower timeframes, which could serve as a potential turning point for the continuation of the uptrend.
Additionally, a break above the resistance trendline in these timeframes may signal a shift back to bullish momentum, reaffirming the long-term trend. While the short-term retracement phase suggests temporary bearish pressure, the long-term bullish outlook for US 30 remains intact. Strategic use of forex signals could provide traders with additional insights during this corrective phase.
Note: Learn2.trade is not a financial advisor. Do your research before investing your funds in any financial asset, product, or event. We are not responsible for your investment results.
Trade on MT4 with Leverage up to 1:500! Trade on MT4 with Leverage up to 1:500!
X
We use cookies to ensure that we give you the best experience on our website. If you continue to use this site we will assume that you are happy with it.