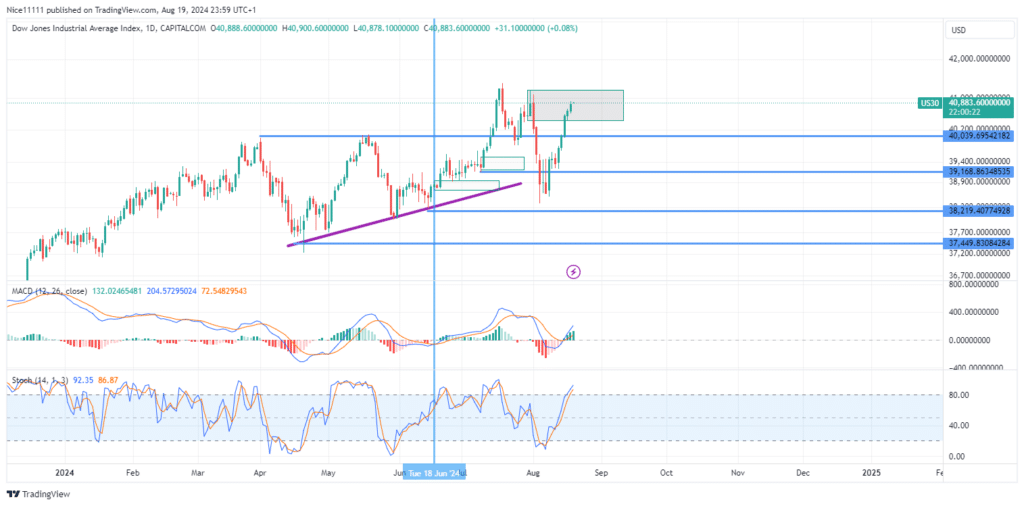
The US 30 index has initiated a strong bullish push by targeting the liquidity-rich regions beneath the key order blocks around $36,169.0. The price is currently advancing toward relative equal highs on the daily chart, where a significant liquidity pool resides, attracting further buying interest.
After breaking above the 40,039.0 resistance level, the US 30 index quickly formed a double top pattern, triggering a notable dip. The price dropped below a crucial bullish order block, which seemed poised to act as support. Following this dip, the Stochastic indicator entered oversold territory, signaling a bullish reversal. The market quickly rebounded, recovering sharply from the zone.
The move below the bullish order block initially suggested a potential bearish reversal. However, the swift recovery indicated that the bearish momentum was short-lived. The MACD (Moving Average Convergence and Divergence) indicator now shows building bullish momentum, further reinforcing the uptrend.
US 30 Short-Term Trend: Bullish
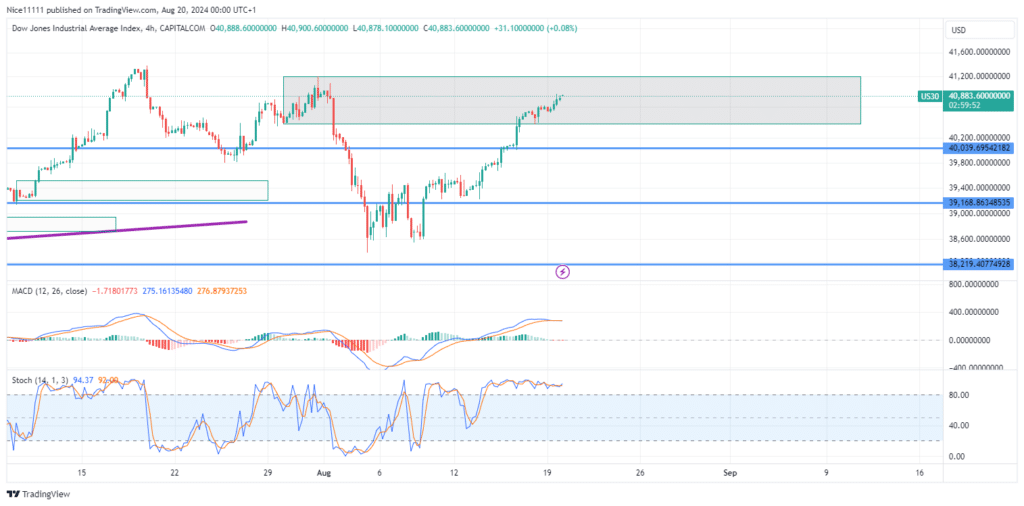
On lower timeframes, the market structure also displays clear bullish forex signals. However, the presence of a fair value gap on the sell side could pose a temporary challenge to the ongoing upward movement. If US 30 manages to break through this gap, it is expected to push higher, potentially reaching 41,400 in the near term.
Note: Learn2.trade is not a financial advisor. Do your research before investing your funds in any financial asset, product, or event. We are not responsible for your investment results.
Trade on MT4 with Leverage up to 1:500! Trade on MT4 with Leverage up to 1:500!
X
We use cookies to ensure that we give you the best experience on our website. If you continue to use this site we will assume that you are happy with it.