Don’t invest unless you’re prepared to lose all the money you invest. This is a high-risk investment and you are unlikely to be protected if something goes wrong. Take 2 minutes to learn more
This week has seen some major movements in the crypto market, with Bitcoin (BTC) breaking its previous all-time high and reaching new levels. Bitcoin briefly traded above $73,000 before retreating to below $70,000, causing notable fluctuations across the market. Among trending coins, Bitcoin leads this week’s list, joined by several other cryptocurrencies that have generated significant attention.
Bitcoin (BTC)
Major Bias: Bearish
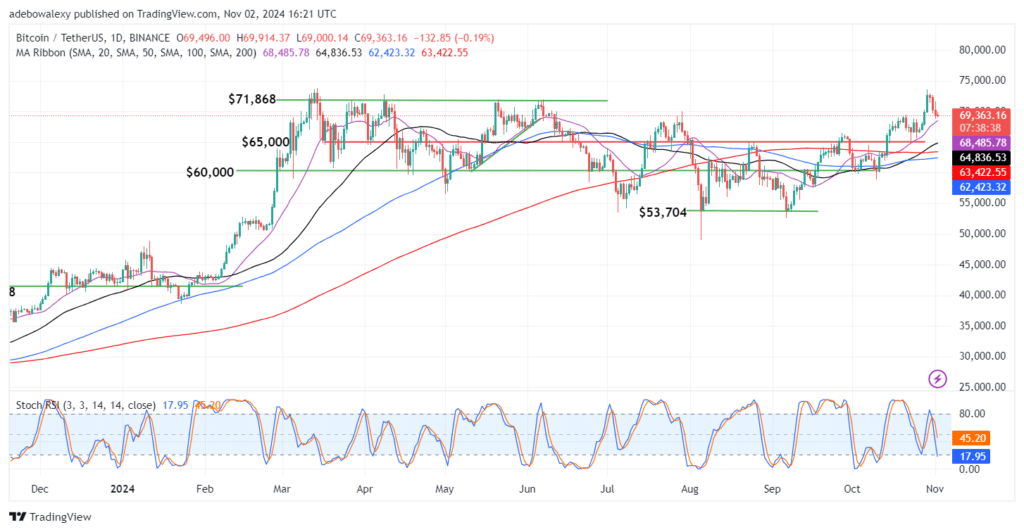
As mentioned, Bitcoin recently broke its previous all-time high of $72,000, trading momentarily above the $73,000 threshold. This surge was accompanied by a roughly 4% price increase over the past seven days, although the coin experienced a 0.5% decline today. Currently, BTC’s market cap is valued at $1.37 trillion, with a trading volume of $28.6 billion.
On the daily price chart, Bitcoin’s price action has retreated toward the 20-day Moving Average (MA) lines, though prices remain above these levels. The most recent price candle is considerably smaller than previous ones, hinting at a possible decrease in bearish momentum. Meanwhile, the Stochastic Relative Strength Index (RSI) lines have dropped significantly into the oversold region. While price action may continue to descend, the 20-day MA line could serve as a support level. Given the market’s trend of finding higher support in recent times, it seems logical for traders to consider the 20-day MA ($68,485) as a potential entry point.
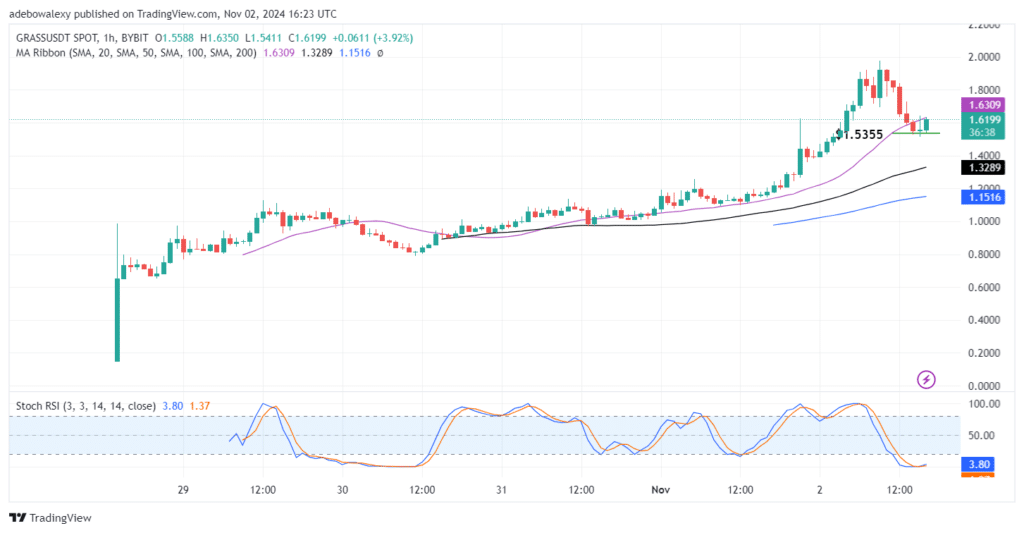
Recently launched, the Grass token has gained substantial attention and hype, positioning it as the second-most trending cryptocurrency this week. GRASS saw a 34.56% price increase today and a significant 99.19% rise over the past seven days. The token currently reports a market cap of $393 million, with a trading volume of $442 million.
For insight into GRASS’s price movement, an analysis of the hourly time frame reveals that price action recently rebounded from the psychological level of $2.00 but retraced to find support at $1.5355. At the time of this report, the market has rebounded toward the 20-day MA curve. Additionally, the Stochastic RSI lines, after reaching the depths of the oversold region, have started to climb upward. This upward trajectory suggests that price action may soon approach the $1.80 mark.
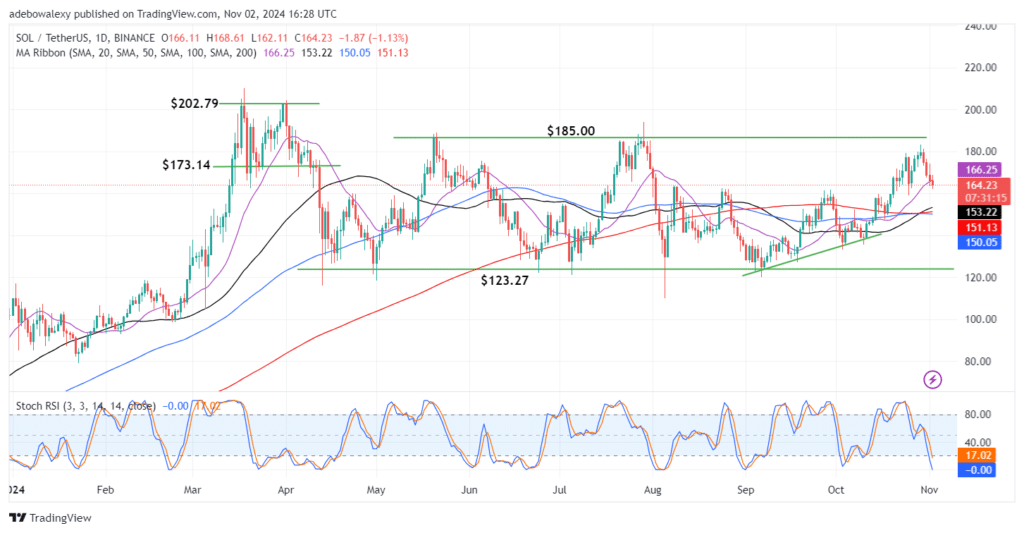
Solana has maintained its status as one of the most popular cryptocurrencies for the past three weeks. This week, it ranks third on the trending list, despite a daily price decrease of 1.04% and a 2.92% dip over the past seven days. SOL’s market cap stands at $77.19 billion, with a trading volume of $1.93 billion.
On the daily chart, Solana’s price action recently rebounded off the $180 price level but has since dropped below the 20-day MA. All other MA lines have crossed below the price action, creating potential support levels. The Stochastic RSI is still descending into the oversold area, with the leading line touching the 0.00 threshold. Despite this, the $160 level could provide a solid baseline, allowing for a potential rebound toward $180. This anticipated movement would enhance the utility of technical crypto signals crafted around such price levels.
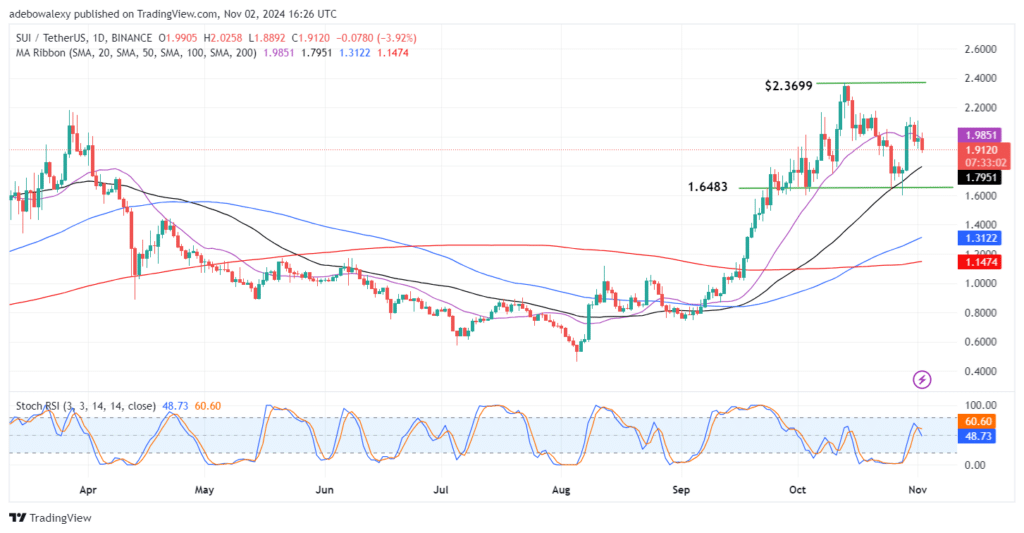
The Sui token has maintained its position on the trending list for three consecutive weeks, ranking fourth. It experienced a 2.95% price reduction today but has seen a 7.38% increase over the past seven days. SUI’s market cap is $5.45 billion, with a trading volume of $572 million.
On the price chart, SUI reached a peak at $2.3699 but has since begun descending toward lower support levels. The latest price candle places SUI below the 20-day MA line. The Stochastic RSI has shown a bearish crossover just above the 50 mark, although price action remains above most other MA lines. Should price action fail to rebound off the 50-day MA line, the $1.6483 level could provide more robust support for an upward rebound, potentially targeting the $2.00 mark.
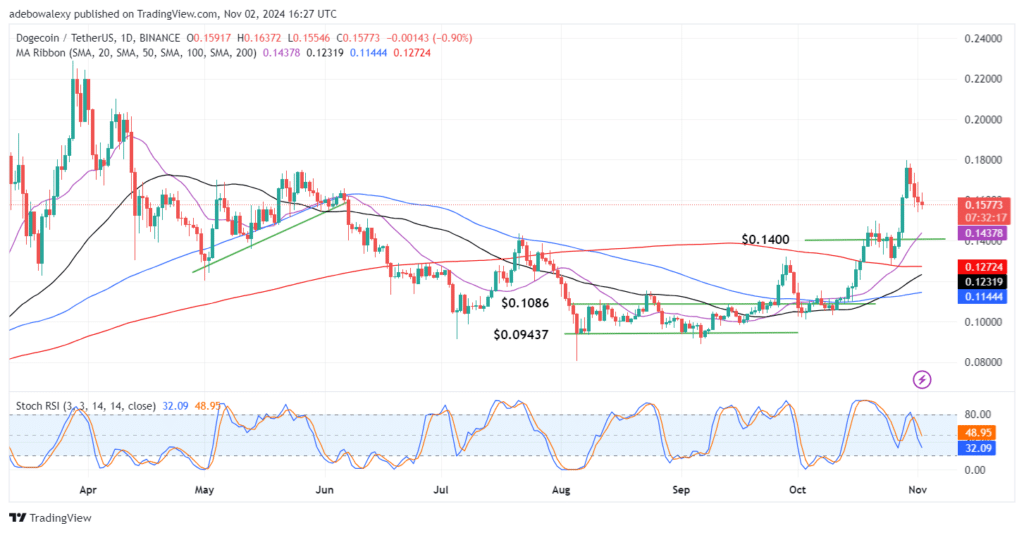
Rounding off this week’s list of trending coins is Dogecoin, which saw a 1.95% price decrease today and a 17.9% rise over the past seven days. DOGE’s market cap is currently $23.13 billion, with a trading volume of $1.59 billion.
Dogecoin’s price chart reveals a continued downward retracement. The token trades above the 20-, 50-, 100-, and 200-day MA lines despite its recent declines. Additionally, the smaller size of recent price candles suggests a potential reduction in bearish momentum. The Stochastic RSI continues to fall toward the oversold region, with the leading line below the 50 mark while the lagging line remains above it. Given the slowing bearish momentum, DOGE may find support around the $0.1550 level, potentially resulting in a market rebound.
Trade on MT4 with Leverage up to 1:500! Trade on MT4 with Leverage up to 1:500!
X
We use cookies to ensure that we give you the best experience on our website. If you continue to use this site we will assume that you are happy with it.