Don’t invest unless you’re prepared to lose all the money you invest. This is a high-risk investment and you are unlikely to be protected if something goes wrong. Take 2 minutes to learn more
Three of the coins from last week’s list of trending coins have remained on this week’s list. This implies that these coins have maintained their popularity over the past seven days. Meanwhile, there has been significant movement on this week’s list of trending cryptocurrencies. The GOAT token has moved up two spots, while BTC has moved up one spot from last week.
X Empire (X)
Major Bias: Bearish
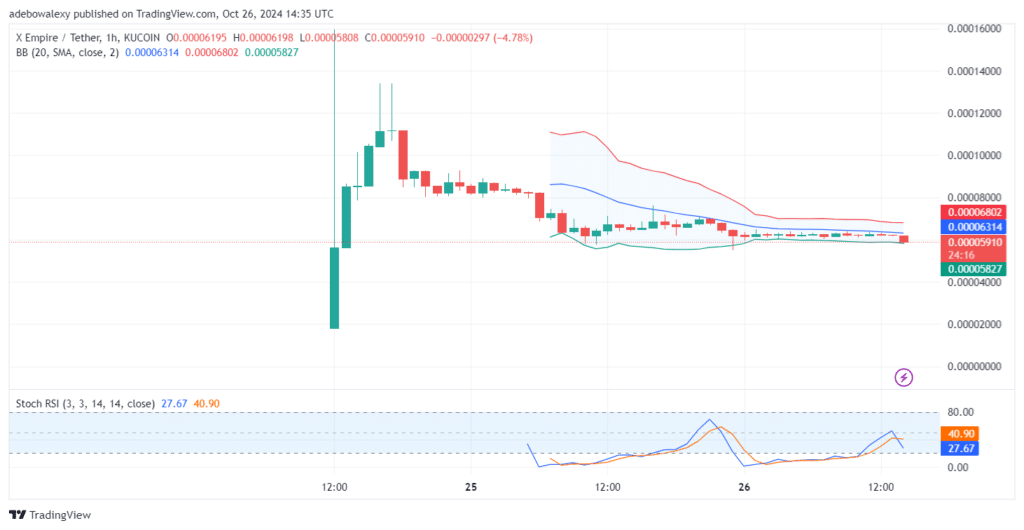
The X token has claimed the top spot on this week’s list of trending coins despite its bearish outlook. As of the time of writing, the coin has experienced a price decline of 10.40% today and a 44.89% price decrease over the past seven days. The coin has a self-reported market capitalization of $28.74 million and a trading volume of $72.15 million. The coin was launched only a few days ago and, as such, will be analyzed on a 1-hour price chart.
The token’s price chart shows that its price has been on a steady decline but appears to have recently entered a consolidation phase. The latest candle on the chart suggests that the bearish momentum has increased. Additionally, the Stochastic Relative Strength Index (Stochastic RSI) indicator lines have just crossed bearishly. Likewise, the ensuing lines of the indicator are moving downward into the oversold region. Given that price action lies below the middle Bollinger Bands, prices in this market may descend toward the $0.00005500 threshold.
Current Price: $0.00005910
Market Capitalization: $28.74 million
Trading Volume: $72.15 million
7-Day Gain/Loss: -44.89%
BTC (Bitcoin)
Major Bias: Bullish
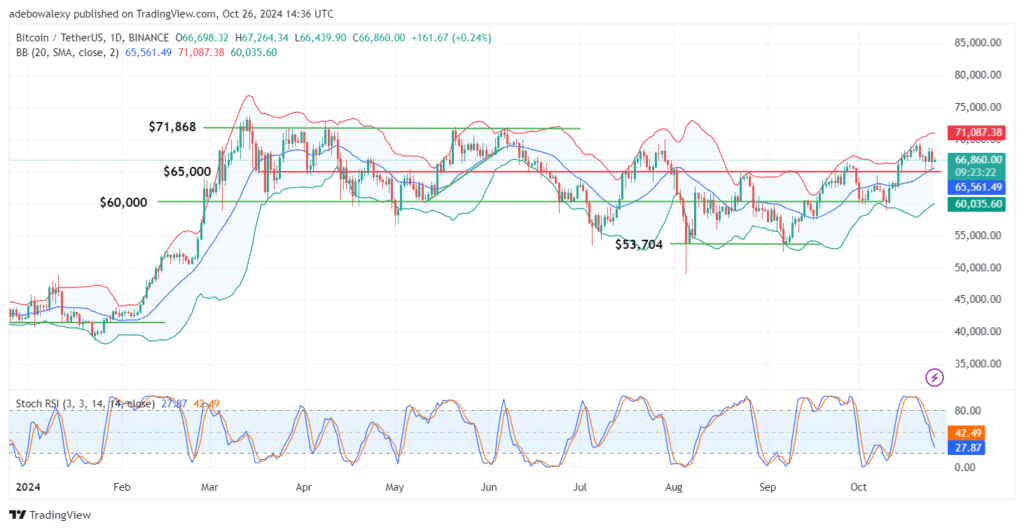
Bitcoin has seen significant movement over the past seven days, reaching the second spot on this week’s list of trending coins. As of today, BTC has experienced a price reduction of 2.78% and a 2.15% decrease over the past seven days. Its market cap stands at an impressive $1.32 trillion, with a trading volume of $37.51 billion.
Price action in this market has continued to oscillate between the $70,000 and $65,000 levels. The ongoing session has appeared as a green price candle, though it is relatively small. Meanwhile, trading continues above the middle Bollinger Band, which has a slight upward trajectory. However, the Stochastic RSI lines are dipping into the oversold region. Despite this, the $65,000 level generally provides strong support, so price action may re-test the $70,000 level soon.
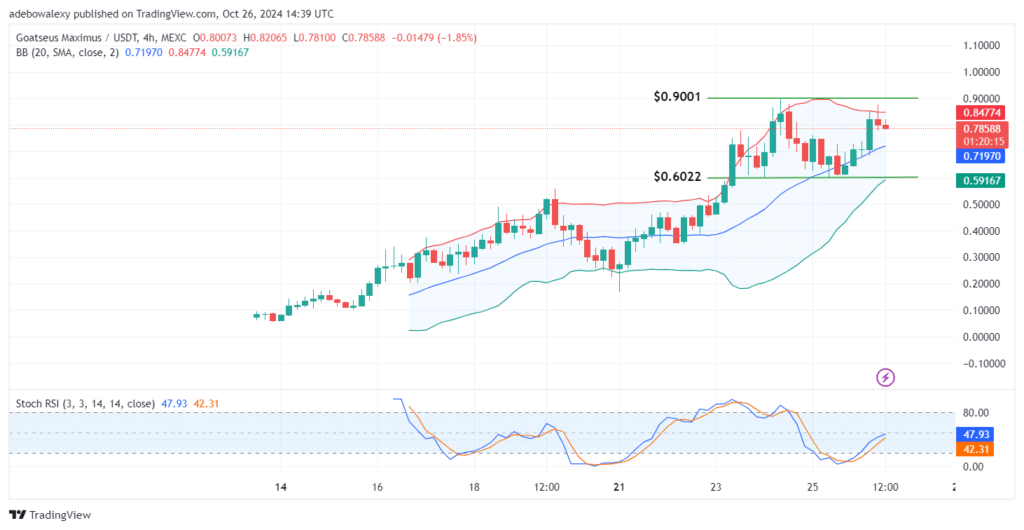
The Goatseus Maximus token has experienced impressive price increases, making it the most profitable coin on this list. It has seen a price increase of 17.38% today and a 60.09% increase over the past seven days. The token has a market cap of $783.56 million and a trading volume of $389.99 million. For a clearer insight into its price movement, the coin is analyzed on a 4-hour chart.
On the price chart, price action in the market has been contained between the $0.9001 and $0.6022 levels. Recent price candles have been bearish but remain above the middle Bollinger Band. Simultaneously, the Stochastic RSI lines have maintained an upward trajectory despite short-term price declines. Given the position of price action and the Stochastic RSI lines’ trajectory, the market may re-test the $0.9000 level.
Current Price: $0.7856
Market Capitalization: $783.56 million
Trading Volume: $389.99 million
7-Day Gain/Loss: +60.09%
Solana (SOL)
Major Bias: Bearish
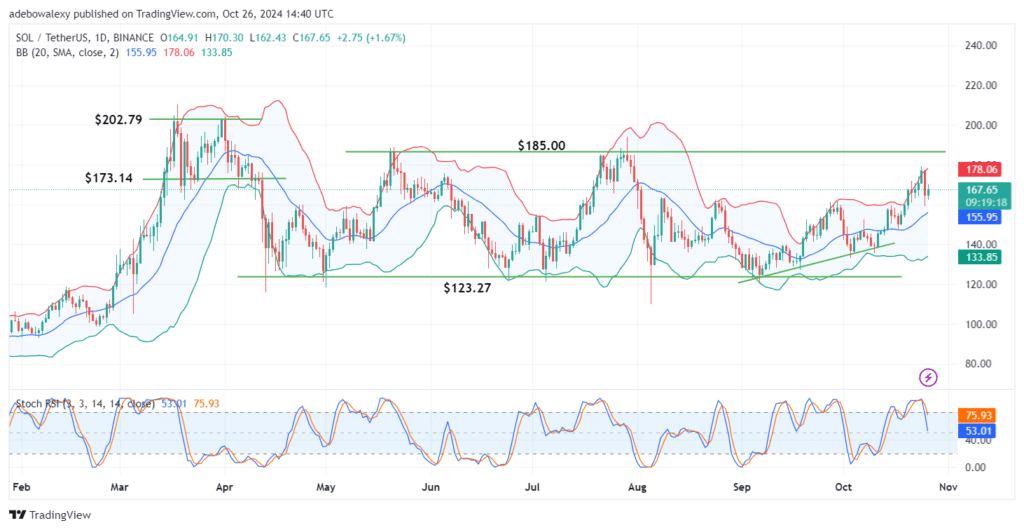
In the fourth spot on this week’s list is Solana. This coin has shown impressive performance over the past seven days. Although the coin has seen a price decline of 4.52% today, its price has increased by 8.11% over the past seven days. Its market cap is $78.90 billion, with a trading volume of $4.74 billion.
On the price chart, the $180.00 level has presented a tough resistance to price movement, leading to a downward bounce in the previous session. However, today’s trading activity has shown some gains, as indicated by the appearance of the latest price candle on the chart. The Stochastic RSI indicator lines are falling steeply toward the 50 level. Nonetheless, trading continues above the middle Bollinger Band, which has an upward trajectory, reflecting the short-term trend in the market. Therefore, crypto signals targeting the $180.00 threshold may still be considered useful.
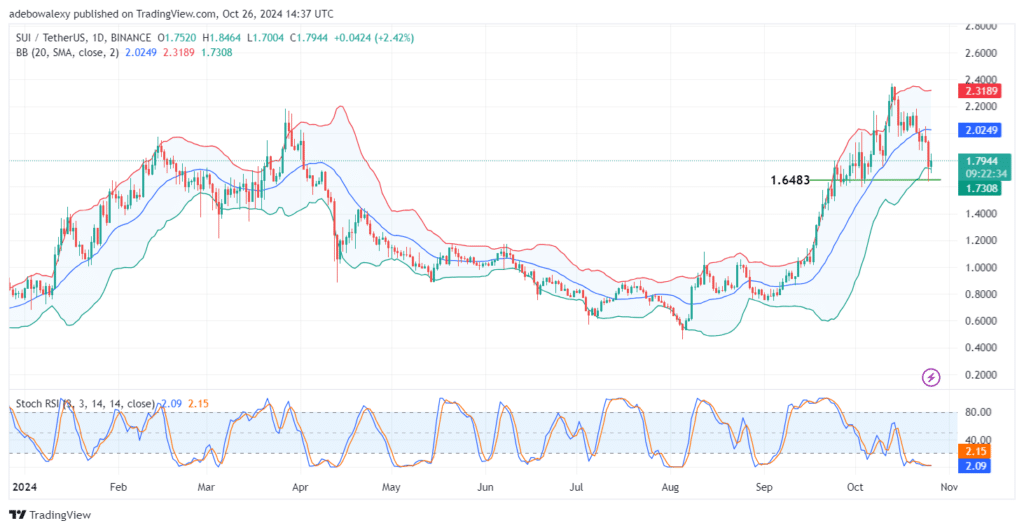
The last coin on this week’s list of trending coins is Sui. This coin has been bearish over the past seven days, with a price reduction of 6.25% today and 12.71% over the week. As of the time of writing, its market cap is $4.97 billion, with a trading volume of $871.16 million.
The price chart shows that bearish forces have controlled price movement since the market approached the $2.400 threshold. However, the $1.6483 level appears to provide strong support, as the market rebounded off it when price action tested this support in the previous session. The ongoing session has seen an additional upside retracement, with the corresponding price candle appearing green. Meanwhile, the Stochastic RSI lines are moving sideways in the oversold region. The latest price candle has both upper and lower shadows, suggesting that both upward and downward pressures are in play, limiting the upside retracement. Consequently, the market may retest the $1.6483 support level.
Current Price: $1.7944
Market Capitalization: $4.97 billion
Trading Volume: $871.16 million
7-Day Gain/Loss: -12.71%
Trade on MT4 with Leverage up to 1:500! Trade on MT4 with Leverage up to 1:500!
X
We use cookies to ensure that we give you the best experience on our website. If you continue to use this site we will assume that you are happy with it.