Don’t invest unless you’re prepared to lose all the money you invest. This is a high-risk investment and you are unlikely to be protected if something goes wrong. Take 2 minutes to learn more
The majority of the coins on CoinMarketCap’s list of trending coins are on a downtrend. This is so despite the fact that these coins are trendy. Also, it is necessary to note that most of these coins are newly launched, which gives insight into how we shall examine their price action.
Pepe (PEPE):
Major Bias: Bullish
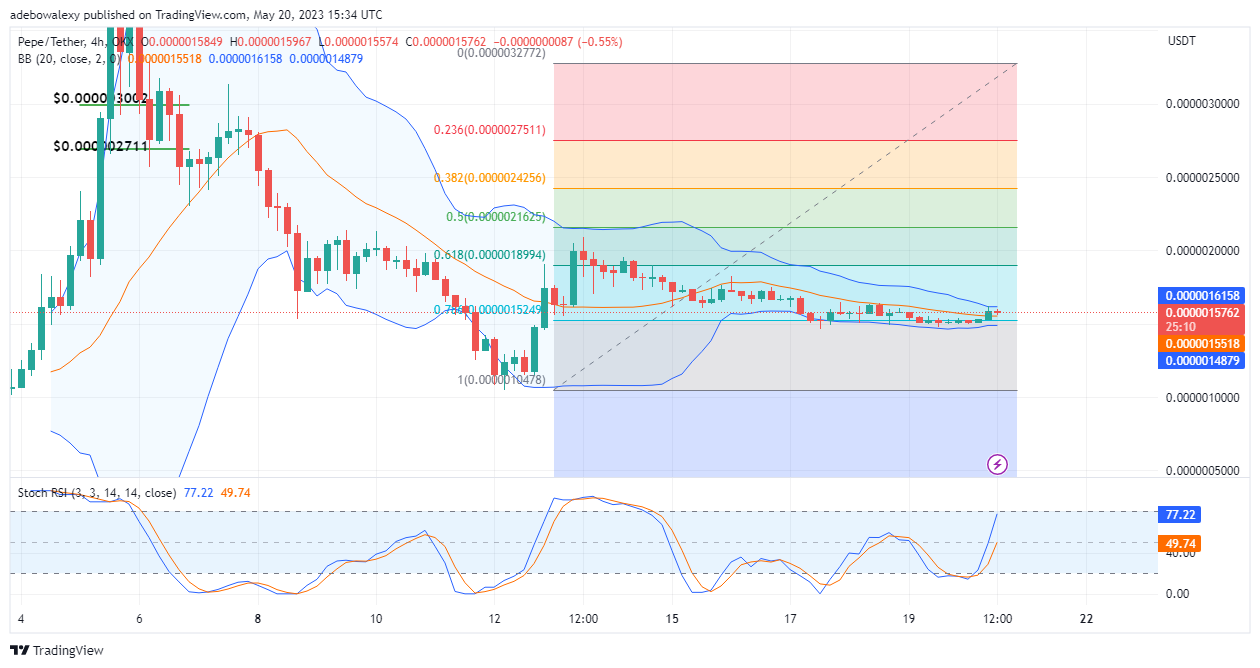
Pepe is the only coin on this week’s list of trending coins to have experienced some gains in the last 24 hours. This coin has recorded a 3.90% profit today while witnessing losses of 16.43% in the past 7 days. With a market capitalization of $616,356,106, this coin has remained in the number one spot on the CoinMarketCap list of trending coins for about three weeks in a row. Also, the behavior of price action in the PEPE/USD 4-hour market also hints at an impending significant upside price move. Here, the Bollinger Bands indicator can be seen narrowing up. Although the last price candle is a red one, it stands above the middle band of the Bollinger Bands. In addition, the curves of the Relative Strength Index (RSI) are trending upward to suggest increasing buying momentum. Consequently, prices may retrace the 0.000002000 mark in this market.
Current Price: $0.000001576
Market Capitalization: $616,356,106
Trading Volume: $165,514,074
7-Day Gain/Loss: 16.43%
Wagmi (WAGMI)
Major Bias: Bearish
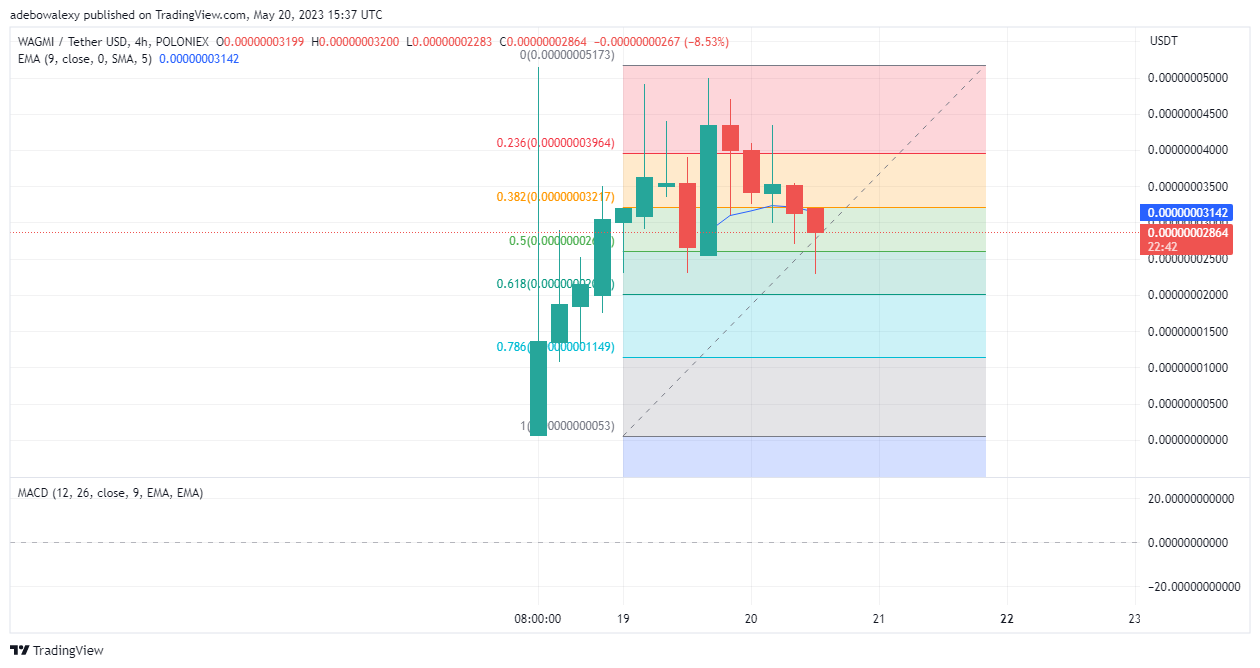
The Wagmi coin is one of the two arrivals on this week’s list of CoinMarketCap trending coins. Wagmi was launched less than three days ago. This coin has a market capitalization of $11,322,530 and has lost 3.24% in price today. Meanwhile, since Wagmi’s pump, the coin has landed at 88.43% pump. Considering the 4-hour market chart, it could be seen that the price action for this coin seems to have crossed into the headwind zone. The last price candle here has formed below the 9-day Moving Average curve. Also, it could be seen that this price candle has formed under the 38.20 Fibonacci Retracement level. At this point, traders can expect price action in this market to hit the $0.00000002600s soon.
Current Price: $0.00000002864
Market Capitalization: $11,322,530
Trading Volume: $14,152,497
7-Day Gain/Loss: 88.43%
Sui (SUI)
Major Bias: Bearish
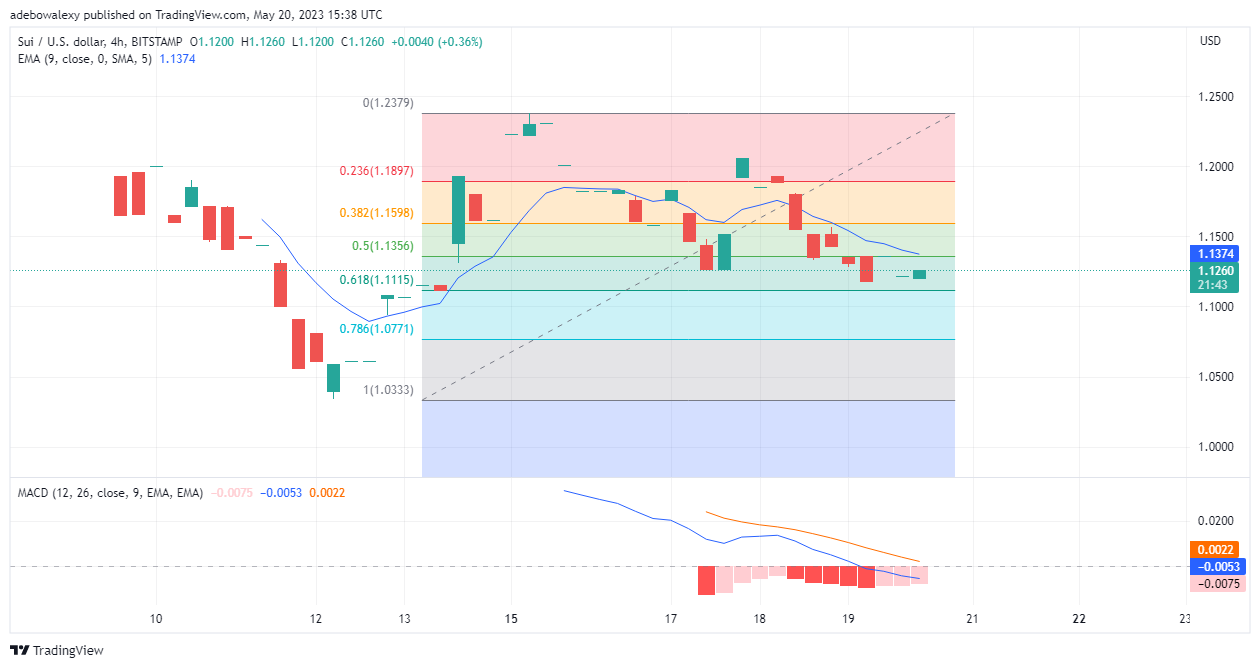
Sui comes in third on this week’s list of trending coins. However, the coin has only recorded minimal gains in the past 7 days. And just today, a considerable portion of those gains have been lost. Sui has a market capitalization of $594,787,462 and a trading volume of $90,841,684. Furthermore, price action in the SUI/USD market seems to be very volatile. Also, from recent price behavior, it could be inferred that price movement is bearish, despite the minimal profits in the ongoing session. This is because price action stays under the 9-day MA line on this chart. Although the Moving Average Convergence Divergence indicator (MACD) is trending downward, it is important to note that the bars of this indicator are pale red, showing that downward forces are weakening. Nevertheless, price action has bearish potential, and traders can expect a retracement of the $1.112 mark.
Current Price: $1.130
Market Capitalization: $594,787,462
Trading Volume: $90,841,684
7-Day Gain/Loss: 2.21%
Abitrum (ARB)
Major Bias: Bearish
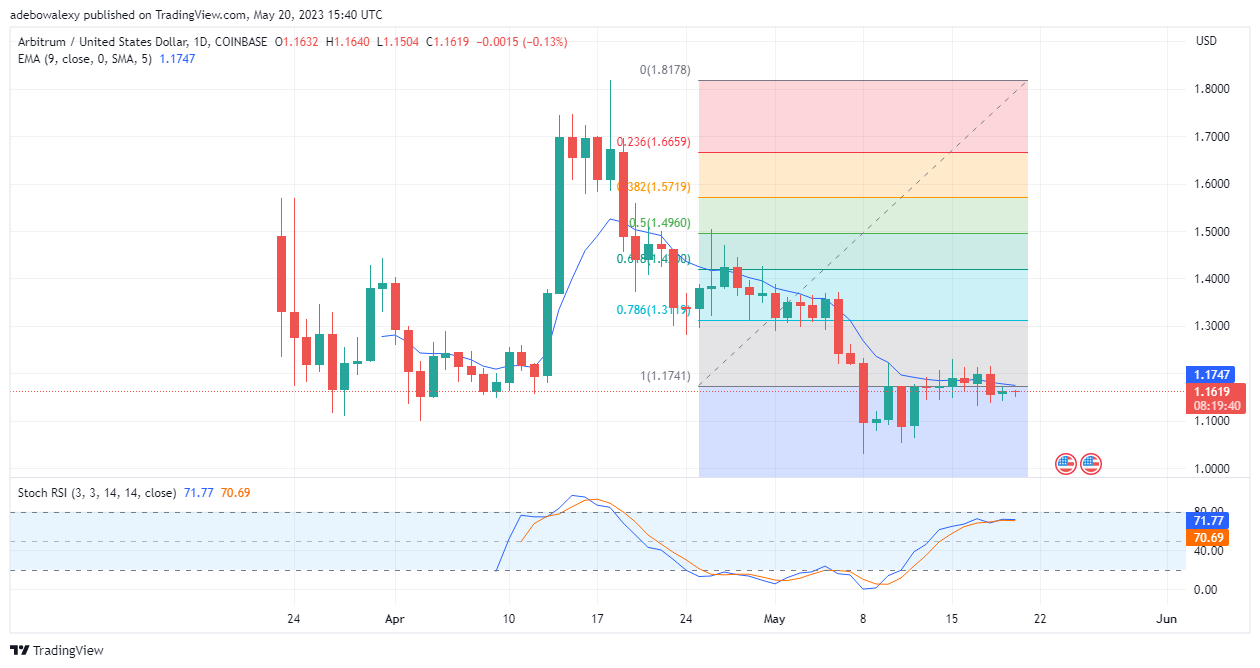
Abitrum occupies the fourth spot on this week’s list. Despite the wave that this token has made in recent times, its price seems to be in a downtrend over the past 30 days. Abitrum has lost 0.46% in value over the past 24 hours, and 0.78% in the past seven days. On the ARB/USDT daily market, this token price action has remained under the 9-day MA curve. Also, the curve of the Stochastic RSI indicator is now interwound and seems to be trending sideways. Two things can be deduced here. At first, since price action stays under the 9-day Moving Average, it suggests that this market may witness more downward retracements. In addition, the RSI indicator suggests that price action lacks the momentum to retrace considerably upwards. Therefore, prices may fall toward the $1.100 mark soon.
Current price: 1.162
Market capitalization: $1,476,091,482
Trading volume: $116,090,607
7-Day Gain/Loss: 0.78%
Love Hate Inu (LHINU)
Major Bias: Bullish
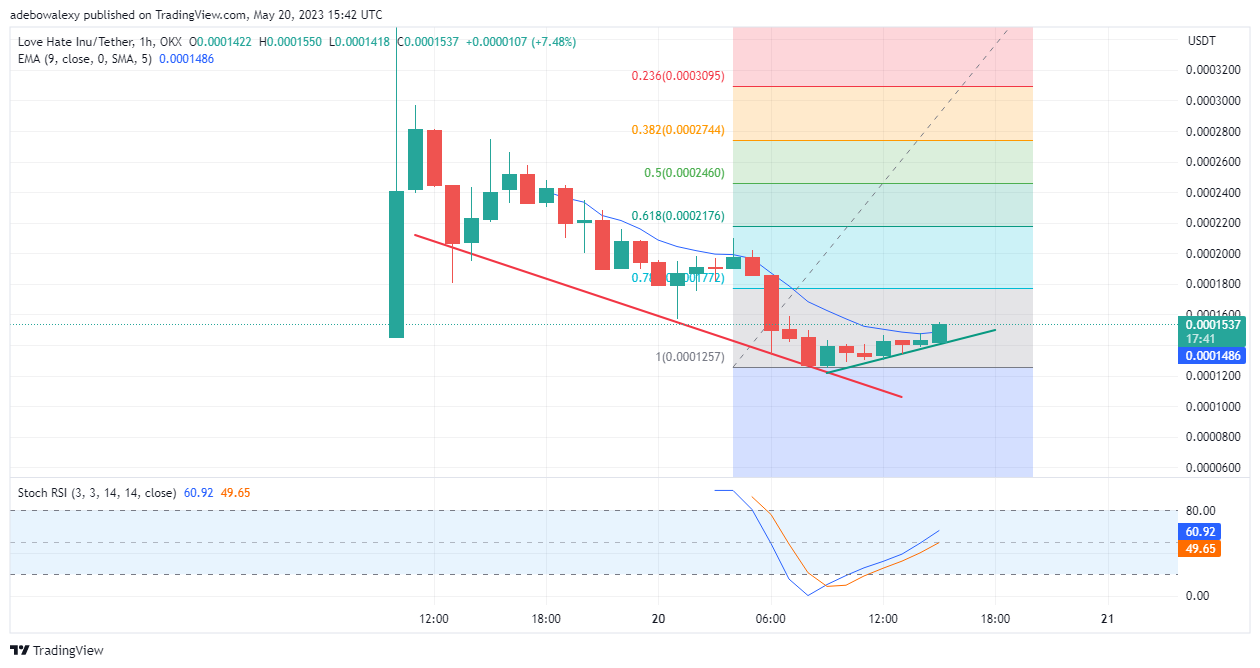
A recently launched token, Love Hate Inu, comes in the last place on this week’s top five trending coins on CoinMarketCap. Going by statistics obtained from CoinMarketCap, this coin looks bearish. Over the past 24 hours, this coin has witnessed losses of 42.04%, while seeing a loss of 62.94% over the past 7 days. To have a good view of price 6 in this market, we shall examine its hourly market. Here, this market seems to have achieved a trend reversal. This is because green price candles have pushed prices above the 9-day MA curve. Also, the RSI lines are rising steadily towards the overbought area of the indicator. Should the price candle for the next session form above the MA line, traders can anticipate a retracement of the $0.0001800 price level.
Current price: $0.008050
Market capitalization: $2,912,753
Trading volume: $30,151,410
7-Day Gain/Loss: $30,151,410
Do you want to take your trading to the next level? Join the best platform for that here.
- Broker
- Min Deposit
- Score
- Visit Broker
- Award-winning Cryptocurrency trading platform
- $100 minimum deposit,
- FCA & Cysec regulated
- 20% welcome bonus of upto $10,000
- Minimum deposit $100
- Verify your account before the bonus is credited
- Fund Moneta Markets account with a minimum of $250
- Opt in using the form to claim your 50% deposit bonus
Learn to Trade
Never Miss A Trade Again

Signal Notification
Real-time signal notifications whenever a signal is opened, closes or Updated

Get Alerts
Immediate alerts to your email and mobile phone.

Entry Price Levels
Entry price level for every signal Just choose one of our Top Brokers in the list above to get all this free.


