Don’t invest unless you’re prepared to lose all the money you invest. This is a high-risk investment and you are unlikely to be protected if something goes wrong. Take 2 minutes to learn more
Given the recent state of the crypto market, most coins are fighting against headwinds, while others have already succumbed to the prevalent headwind driving the market. Stellar (XLM) is one of those cryptos fighting against headwinds. Let’s closely examine this market to understand what may soon happen in it.
XLM Analysis Data
Stellar Value Now: $0.08897
Stellar Market Cap: $2,385,687,888
XLM Moving Supply: 26,793,799,397.09 XLM
Stellar Total Supply: 50,001,806,812 XLM
XLM CoinMarketCap Ranking: 26
Major Price Levels:
Top: $0.08897, $0.08930, and $0.08960
Base: $0.08867, $0.08837, and $0.08800
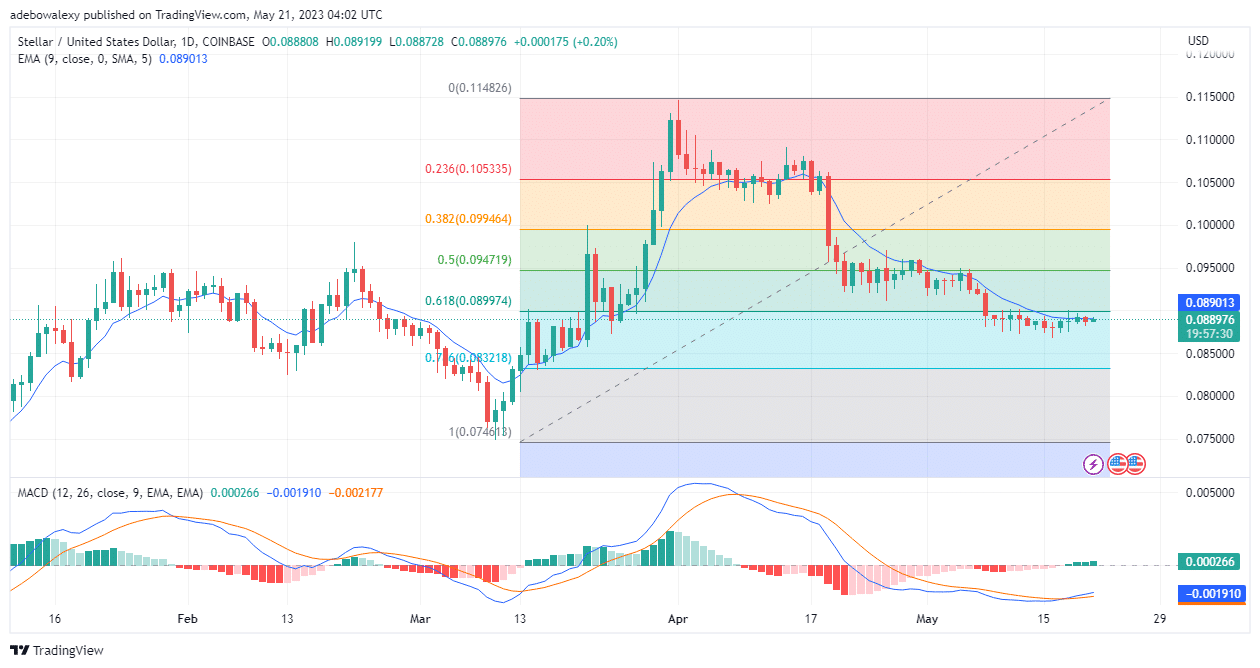
Stellar (XLM) Fights Headwind, Set to Break Resistance at 0.08900
Since April 19th, price action in the Stellar daily market has remained mostly under the 9-day Moving Average (MA) curve. Buyers have made attempts to break the resistance at $0.08900 but have failed. Therefore, the current attempt isn’t exceptional. However, a green price candle has just appeared in the ongoing trading session and has pushed prices to test the 9-day MA curve. Also, green histogram bars can be seen appearing above the equilibrium level of the Moving Average Convergence Divergence (MACD) indicator. Consequently, this gives the impression that an upside move may be developing in this market.
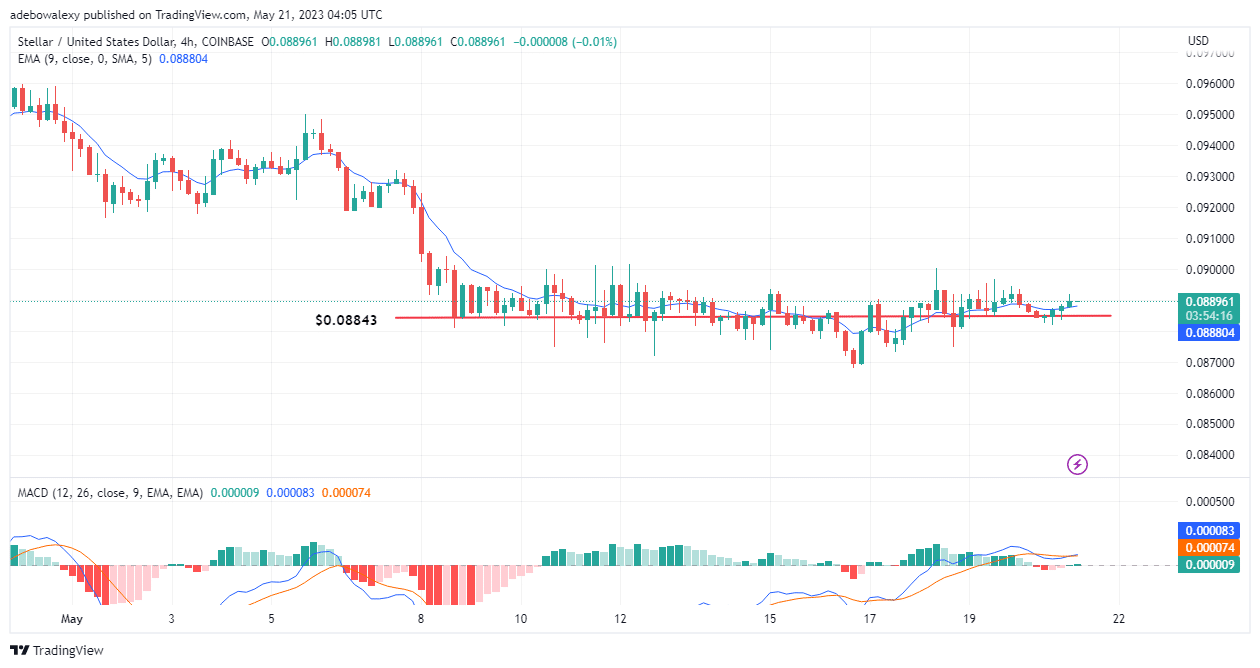
Stellar (XLM) Seeks to Extend the Upside Move
On the XLM/USD shorter time frame of 4 hours, price action has crossed above the 9-day MA line. Not only that, but the appearance of another green dashed-shaped price candle seems to suggest that buyers have started early in the session. Additionally, here the MACD indicator has given a crossover above the equilibrium level. Even though this crossover seems less vibrant, it still offers some upside for this market. Consequently, this suggests that at least the $0.08900 will be broken, and price action can retrace towards the $0.09000.
- Broker
- Min Deposit
- Score
- Visit Broker

- Award-winning Cryptocurrency trading platform
- $100 minimum deposit,
- FCA & Cysec regulated

- 20% welcome bonus of upto $10,000
- Minimum deposit $100
- Verify your account before the bonus is credited
- Fund Moneta Markets account with a minimum of $250
- Opt in using the form to claim your 50% deposit bonus
Learn to Trade
Never Miss A Trade Again

Signal Notification
Real-time signal notifications whenever a signal is opened, closes or Updated

Get Alerts
Immediate alerts to your email and mobile phone.

Entry Price Levels
Entry price level for every signal Just choose one of our Top Brokers in the list above to get all this free.