FX Leaders provides excellent trading signals on WTI crude oil (USOIL). WTI is the abbreviation for West Texas Intermediate.
3
Payment methods
Trading platforms
Regulated by
Support
Min.Deposit
Leverage max
Currency Pairs
Classification
Mobile App
Rating
Total cost
$ 0
![]() Commission
3.5
Commission
3.5
Min.Deposit
$100
Spread min.
Variables pips
Leverage max
100
Currency Pairs
40
Trading platforms
Funding Methods


Regulated by
FCA
What you can trade
Forex
Indices
Actions
Cryptocurrencies
Raw Materials
Average spread
EUR/GBP
-
EUR/USD
-
EUR/JPY
0.3
EUR/CHF
0.2
GBP/USD
0.0
GBP/JPY
0.1
GBP/CHF
0.3
USD/JPY
-
USD/CHF
0.2
CHF/JPY
0.3
Additional Fee
Continuous rate
Variables
Conversión
Variables pips
Regulation
Yes
FCA
No
CYSEC
No
ASIC
No
CFTC
No
NFA
No
BAFIN
No
CMA
No
SCB
No
DFSA
No
CBFSAI
No
BVIFSC
No
FSCA
No
FSA
No
FFAJ
No
ADGM
No
FRSA
71% of retail investor accounts lose money when trading CFDs with this provider.
Rating
Total cost
$ 0
![]() Commission
0
Commission
0
Min.Deposit
$100
Spread min.
- pips
Leverage max
400
Currency Pairs
50
Trading platforms
Funding Methods
Regulated by
CYSECASICCBFSAIBVIFSCFSCAFSAFFAJADGMFRSA
What you can trade
Forex
Indices
Actions
Cryptocurrencies
Raw Materials
Etfs
Average spread
EUR/GBP
1
EUR/USD
0.9
EUR/JPY
1
EUR/CHF
1
GBP/USD
1
GBP/JPY
1
GBP/CHF
1
USD/JPY
-
USD/CHF
1
CHF/JPY
1
Additional Fee
Continuous rate
-
Conversión
- pips
Regulation
No
FCA
Yes
CYSEC
Yes
ASIC
No
CFTC
No
NFA
No
BAFIN
No
CMA
No
SCB
No
DFSA
Yes
CBFSAI
Yes
BVIFSC
Yes
FSCA
Yes
FSA
Yes
FFAJ
Yes
ADGM
Yes
FRSA
71% of retail investor accounts lose money when trading CFDs with this provider.
Rating
Total cost
$ 0
![]() Commission
0.1
Commission
0.1
Min.Deposit
$50
Spread min.
- pips
Leverage max
500
Currency Pairs
40
Trading platforms
Funding Methods
What you can trade
Forex
Indices
Actions
Raw Materials
Average spread
EUR/GBP
-
EUR/USD
-
EUR/JPY
-
EUR/CHF
-
GBP/USD
-
GBP/JPY
-
GBP/CHF
-
USD/JPY
-
USD/CHF
-
CHF/JPY
-
Additional Fee
Continuous rate
-
Conversión
- pips
Regulation
No
FCA
No
CYSEC
No
ASIC
No
CFTC
No
NFA
No
BAFIN
No
CMA
No
SCB
No
DFSA
No
CBFSAI
No
BVIFSC
No
FSCA
No
FSA
No
FFAJ
No
ADGM
No
FRSA
71% of retail investor accounts lose money when trading CFDs with this provider.
This is really exciting because crude oil is a really volatile instrument which can make impressive movements in short periods of time. Of course, volatile instruments can be dangerous but if you know what you’re doing there is a lot of money to be made with it.
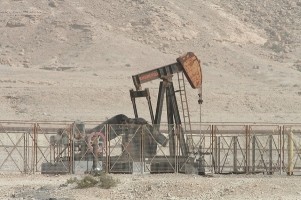
Countries With the Largest Oil Reserves
The Middle East is incredibly rich in oil reserves and a substantial part of the world’s oil is trapped in this region.
3
Payment methods
Trading platforms
Regulated by
Support
Min.Deposit
Leverage max
Currency Pairs
Classification
Mobile App
Rating
Total cost
$ 0
![]() Commission
3.5
Commission
3.5
Min.Deposit
$100
Spread min.
Variables pips
Leverage max
100
Currency Pairs
40
Trading platforms
Funding Methods
Regulated by
FCA
What you can trade
Forex
Indices
Actions
Cryptocurrencies
Raw Materials
Average spread
EUR/GBP
-
EUR/USD
-
EUR/JPY
0.3
EUR/CHF
0.2
GBP/USD
0.0
GBP/JPY
0.1
GBP/CHF
0.3
USD/JPY
-
USD/CHF
0.2
CHF/JPY
0.3
Additional Fee
Continuous rate
Variables
Conversión
Variables pips
Regulation
Yes
FCA
No
CYSEC
No
ASIC
No
CFTC
No
NFA
No
BAFIN
No
CMA
No
SCB
No
DFSA
No
CBFSAI
No
BVIFSC
No
FSCA
No
FSA
No
FFAJ
No
ADGM
No
FRSA
71% of retail investor accounts lose money when trading CFDs with this provider.
Rating
Total cost
$ 0
![]() Commission
0
Commission
0
Min.Deposit
$100
Spread min.
- pips
Leverage max
400
Currency Pairs
50
Trading platforms
Funding Methods
Regulated by
CYSECASICCBFSAIBVIFSCFSCAFSAFFAJADGMFRSA
What you can trade
Forex
Indices
Actions
Cryptocurrencies
Raw Materials
Etfs
Average spread
EUR/GBP
1
EUR/USD
0.9
EUR/JPY
1
EUR/CHF
1
GBP/USD
1
GBP/JPY
1
GBP/CHF
1
USD/JPY
-
USD/CHF
1
CHF/JPY
1
Additional Fee
Continuous rate
-
Conversión
- pips
Regulation
No
FCA
Yes
CYSEC
Yes
ASIC
No
CFTC
No
NFA
No
BAFIN
No
CMA
No
SCB
No
DFSA
Yes
CBFSAI
Yes
BVIFSC
Yes
FSCA
Yes
FSA
Yes
FFAJ
Yes
ADGM
Yes
FRSA
71% of retail investor accounts lose money when trading CFDs with this provider.
Rating
Total cost
$ 0
![]() Commission
0.1
Commission
0.1
Min.Deposit
$50
Spread min.
- pips
Leverage max
500
Currency Pairs
40
Trading platforms
Funding Methods
What you can trade
Forex
Indices
Actions
Raw Materials
Average spread
EUR/GBP
-
EUR/USD
-
EUR/JPY
-
EUR/CHF
-
GBP/USD
-
GBP/JPY
-
GBP/CHF
-
USD/JPY
-
USD/CHF
-
CHF/JPY
-
Additional Fee
Continuous rate
-
Conversión
- pips
Regulation
No
FCA
No
CYSEC
No
ASIC
No
CFTC
No
NFA
No
BAFIN
No
CMA
No
SCB
No
DFSA
No
CBFSAI
No
BVIFSC
No
FSCA
No
FSA
No
FFAJ
No
ADGM
No
FRSA
71% of retail investor accounts lose money when trading CFDs with this provider.
However, the country with the largest proven oil reserves in the world is Venezuela. Let’s take a look at which countries have the largest reserves of unextracted oil. (Statistics at the start of 2017):
- Venezuela: 300.878 billion barrels.
- Saudi Arabia: 266.455 billion barrels.
- Canada: 169.709 billion barrels.
- Iran: 158.4 billion barrels.
- Iraq: 142.503 billion barrels.
- Kuwait: 101.5 billion barrels.
- United Arab Emirates: 97.8 billion barrels.
- Russia: 80 billion barrels.
- Libya: 48.363 billion barrels.
- United States: 35.23 billion barrels.
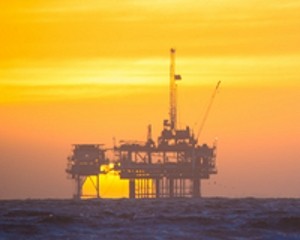
History and Background of Oil Extraction and Consumption
Now that we know where the most ‘black gold’ is found, let’s briefly look at where and when oil was first extracted in reasonably large quantities.
In 1859, a man drilled a hole on a farm in Pennsylvania and struck oil at about 70 feet. The oil quickly filled the hole.
Since that day, oil extraction quickly increased in the region and three years later the oil entrepreneurs were extracting this commodity at an annual rate of about 3 million barrels.
Back then, only a certain part of the unrefined oil was utilized – kerosene, which was used for lighting.
Soon after Thomas Edison invented the incandescent light bulb in 1879, the demand for kerosene and consequently, oil, began to deteriorate.
Soon after this, however, cars driven by internal combustion engines appeared on the scene. The demand for gasoline surged and within a decade it was selling faster than kerosene.

By 1956 Americans owned more than 50 million cars. The demand for gasoline was driving oil extraction activities at a rapid pace. Military activities also consumed much oil.
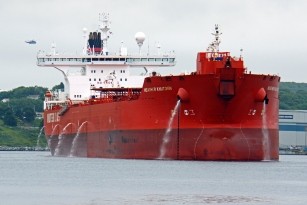
Of course, oil extraction wasn’t limited to the United States only. As the demand for oil increased, oil extracting activities spread to many other places in the world which include Mexico, the Middle East, Canada, and Russia.
In this modern time, millions of barrels of oil are extracted daily to supply the world’s massive energy demand.
Let’s take a look at which countries produce the most oil.
Largest Producers of Oil (Updated September 2016)
- Russia: 10.251 million barrels per day.
- Saudi Arabia: 10.051 million barrels per day.
- United States: 8.744 million barrels per day.
- Iraq: 4.8362 million barrels per day.
- China: 3.9383 million barrels per day.
- Iran: 3.921 million barrels per day.
- Canada: 3.8932 million barrels per day.
- United Arab Emirates: 3.1881 million barrels per day.
- Kuwait: 3.0013 million barrels per day.
- Brazil: 2.6242 million barrels per day.
- Venezuela: 2.3162 million barrels per day.
How to Trade WTI Crude Oil
Although there are other ways to trade oil, we’ll focus only on how it’s done on retail forex trading platforms.
Crude Oil Lot Size
When trading crude oil, the minimum trade size is usually a 10-barrel contract. However, one of my brokers offers a 1-barrel contract. This isn’t very common, though.
A crude oil position of 10 barrels would cost you $500 to open if you didn’t have access to leverage. That is, at a price of $50 a barrel.
Some brokers offer 1:500 leverage on crude, which means that only one dollar of your equity is engaged when you open a 10-barrel position.
Of course, you need additional equity to maintain the position once the oil trade is open because any floating loss needs to be supported by free (available) margin. Immediately after you’ve opened a crude oil trading position, there will be a floating loss of about 5 pips, which is the spread.
Some brokers offer much lower leverage on trading crude oil than 1:500. One of the brokers I trade with, offers leverage of only 1:40.
* Did you know that one barrel of oil is 42 gallons (about 159 liters)?
Crude Oil Pip Value
Most trading platforms consider a pip in crude oil to be $0.01. That means that a $1 price fluctuation in the oil price is equal to 100 pips.
Let’s work with a 10-barrel contract: 10 barrels X $0.01 = $0.10. This is the pip value for trading accounts denominated in U.S. dollar.
This pip value always remains the same because crude oil and the U.S. dollar are paired up with the dollar being the ‘quote currency’ in the ‘pair’. The calculation and the pip value are the same as with the EUR/USD and the GBP/USD, for example.
Profit and Loss Calculation
Here at FX Leaders, we go the extra mile to offer traders the best forex signals possible. In 2016 alone, we bagged a phenomenal 4,907 pips!
We have recently added some really exciting financial instruments to our signals program which include gold, the Nikkei 225, and one of my favorites, crude oil.
I can’t wait to see the first 6 months’ of oil trading signals data, as this volatile instrument has great potential to boost the number of pips we make. Let’s look at how to calculate profits made on crude oil signals, with a simple example:
Let’s calculate how much you’d make if you bought 140 barrels of crude oil at $50 and hit your take profit at $53.75.
The quickest way to calculate your profit is to multiply the number of barrels you bought by the difference between your take profit and the price at which you entered:
$53.75 minus $50.00 = a profit of $3.75. Multiply this by 140 barrels and you get a profit of $525.
Many traders like to calculate their profits or losses by means of multiplying the number of pips (375) by the pip value ($0.10). That number is then multiplied by the number of 10-barrel lots (14) to get the profit of $525. It’s really easy, isn’t it?
Instruments Correlated to Crude Oil
The oil price usually has a notable effect on the currencies of some of the countries that are, to a large degree, dependent on oil production and exports.
A good example of such a country is Canada, which exports most of its petroleum products to the United States.
The Canadian dollar is usually highly correlated to the traded oil price. A sudden drop or rise in the oil price can, under normal market conditions, easily be noticed in the USD/CAD exchange rate, as well as in the rates of other Canadian dollar pairs.
The Norwegian Krone (NOK) and the Danish Krone (DKK) are also highly correlated to the trading oil price.
Major Events that Impact the Oil Price
Events that impact or have the potential to impact the supply or demand of oil tend to move the oil price.
Obviously, production and consumption data also impact the oil price. For example, if the United States crude oil inventories reveal that there’s recently been a substantial draw from U.S. energy reserves, we know that energy consumption, and hence, the demand for oil has increased.
An increase in the demand for oil will put upward pressure on the oil price, except if oil supply increases at the same rate, or faster.
Conversely, when data is released which shows that the demand for oil is waning, it could put downward pressure on the oil price.
News on OPEC’s (Organization of the Petroleum Exporting Countries) oil production can have a major impact on the price of oil.
For example, if they decide to cut oil production it can cause the oil price to rise sharply in a short period of time as investors and speculators quickly buy oil in an effort to gain from the expected rise in the oil price due to the expected reduction of oil supply.
Other factors like sanctions against oil-producing countries, wars in oil-producing countries, bad weather that delays the shipment of oil, increased drilling activities, damage caused to important oil pipelines, the value of the U.S. dollar and other currencies, technological innovations, and other factors can influence the supply and(or) demand for oil, and hence, its price.
AvaTrade - Established Broker With Commission-Free Trades
- Minimum deposit of just 250 USD to get lifetime access to all the VIP channels
- Awarded Best Global MT4 Forex Broker
- Pay 0% on all CFD instruments
- Thousands of CFD assets to trade
- Leverage facilities available
- Instantly deposit funds with a debit/credit card
Forex Signals and Valuable Trading Info
If you’re looking for a breakthrough in your trading career, We would like to invite you to visit our forex signals page. As mentioned earlier, FX Leaders has been providing consistent returns on its free forex signals since inception.
That’s not all, though. We have an amazing library of forex trading strategies, as well in-depth forex broker reviews, real-time news articles, and an all-inclusive forex trading course.
Thank you for visiting the FX Leaders website. Good luck with your trading!
- Check out our free forex signals
- Would you like to get a LIVE alert for every signal? Click here!