Price movements in the SAND market had earlier retreated towards the price level of $0.5237. It appears that this price level was quite strong, and it resulted in an upward price rebound, which took prices from the $0.5600 price level to $0.5611. Yet, technical indicators are suggesting that price action may still be going higher. So, let’s devote more study to this market.
SAND Analysis Data
The Sand Graph Value Now: $0.5611
The Sand Market Cap: $1,039,886,199
Sand Moving Supply: 1,853,581,926.22
The Sand Total Supply: 3,000,000,000
Sand CoinMarketCap Ranking: 43
Major Price Levels:
Top: $0.5611, $0.5651, and $0.5690
Base: $0.5600, $0.5570, and $0.5540
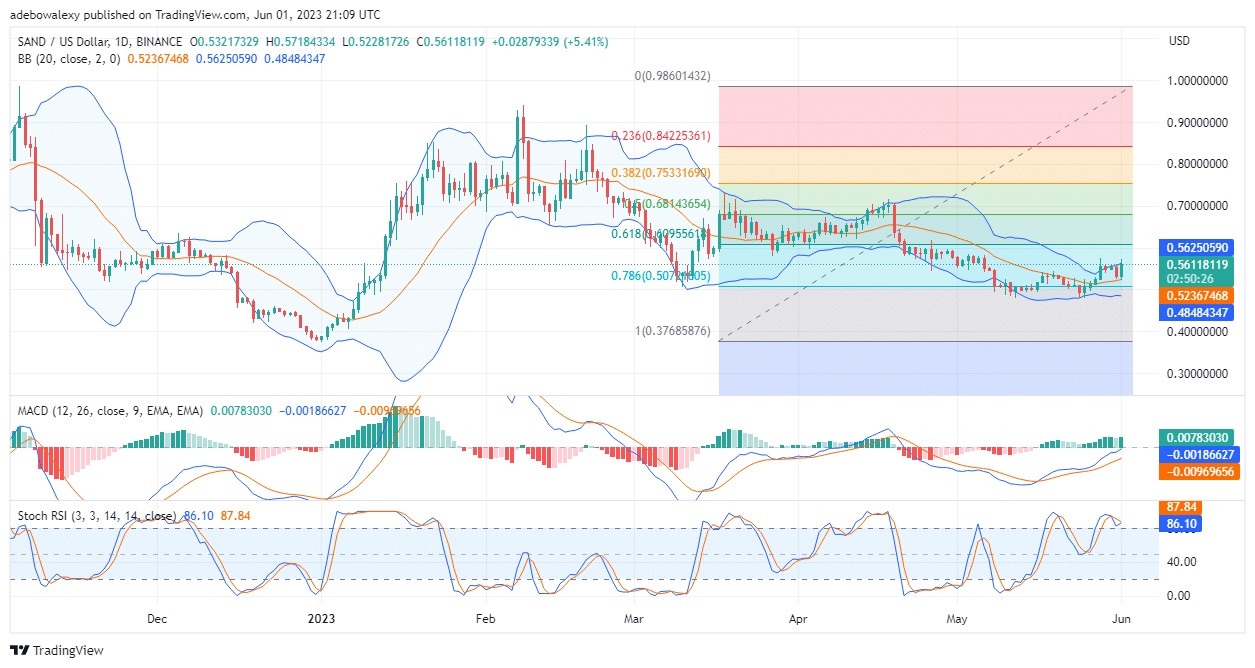
The Sandbox (SAND) Price Set to Continue at the $0.6000 Mark
In the previous trading session on the SAND/USD market, price action bounced very steeply toward support at $0.5237. However, the current session has also seen a more significant rebound in the upward direction. Consequently, this suggests that price action has moved back and forth between a narrow price limit of $0.5237 and $0.5625 in recent times. At this point, price action may further extend profits in an upward direction. The lines of the Moving Average Convergence Divergence (MACD) indicator are moving toward the equilibrium level. Also, its bars are now suggesting that price action is gaining more upside momentum, as they are now solid green in appearance. In addition, a bullish crossover is on the way for the Relative Strength Index (RSI) indicator.
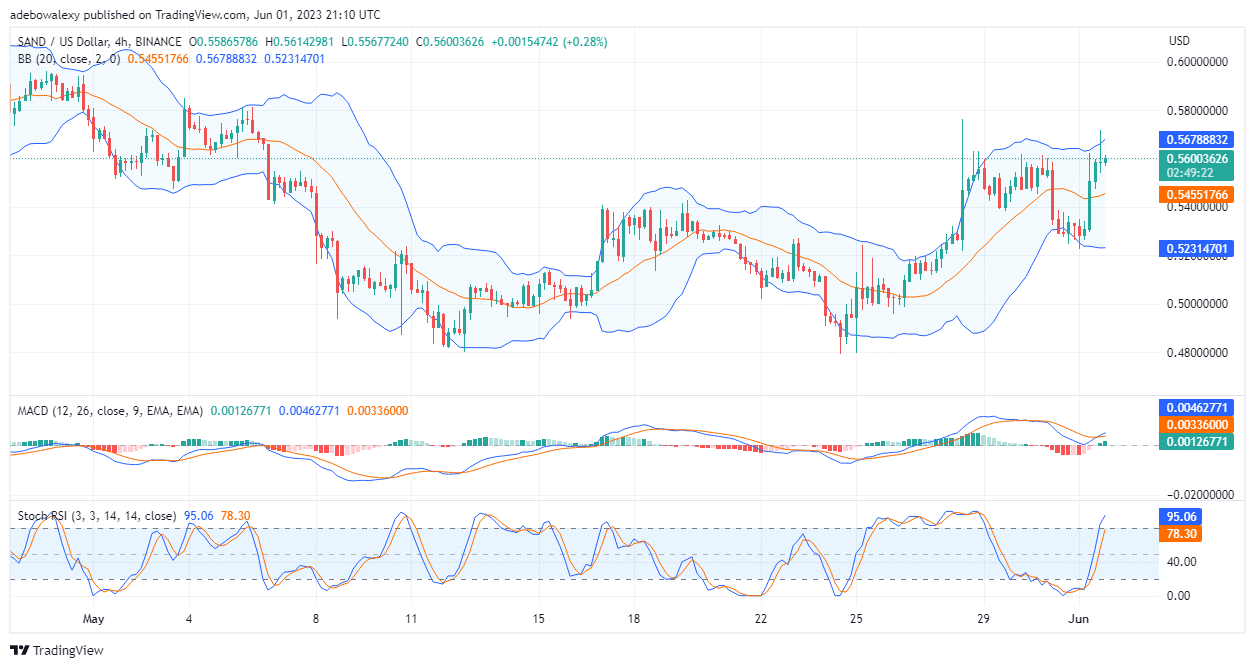
The Sandbox Price Movements Stay on Track Toward the $0.5700 Mark
In the The Sandbox 4-hour market, it could be seen that buyers seem to keep going long and price movements have more upside potential. Price action is above the middle limit of the Bollinger BandS. Also, there is still some distance between the last price candlestick and the uppermost limit of the Bollinger Bands, since it appears that the market is very volatile. Furthermore, an upward crossover can be seen on the MACD indicator, which indicates that prices may accelerate toward higher price levels. Also, the RSI lines keep rising higher into the overbought region. Considering technical indicators, one will agree that this market is at least heading towards a short-term resistance of $0.5700 or higher.
- Broker
- Min Deposit
- Score
- Visit Broker

- Award-winning Cryptocurrency trading platform
- $100 minimum deposit,
- FCA & Cysec regulated

- 20% welcome bonus of upto $10,000
- Minimum deposit $100
- Verify your account before the bonus is credited
- Fund Moneta Markets account with a minimum of $250
- Opt in using the form to claim your 50% deposit bonus
Learn to Trade
Never Miss A Trade Again

Signal Notification
Real-time signal notifications whenever a signal is opened, closes or Updated

Get Alerts
Immediate alerts to your email and mobile phone.

Entry Price Levels
Entry price level for every signal Just choose one of our Top Brokers in the list above to get all this free.