The Graph has moved upward by 1.53%. Nevertheless, price action in this market seems well-placed to extend this profit a bit further. Technical indicators also appear positive about a continued upside but a moderate or minimal retracement. Let’s check it out, shall we?
GRT Analysis Data
The Graph Value Now: $0.1334
GRT Market Cap: $1,191,159,046
GRT Moving Supply: 8,996,169,593.74
The Graph Total Supply: 10,667,903,290.1
GRT CoinMarketCap Ranking: 40
Major Price Levels:
Top: $0.1334, $0.1364, and $0.1400
Base: $0.1304, $0.1284, and $0.1254
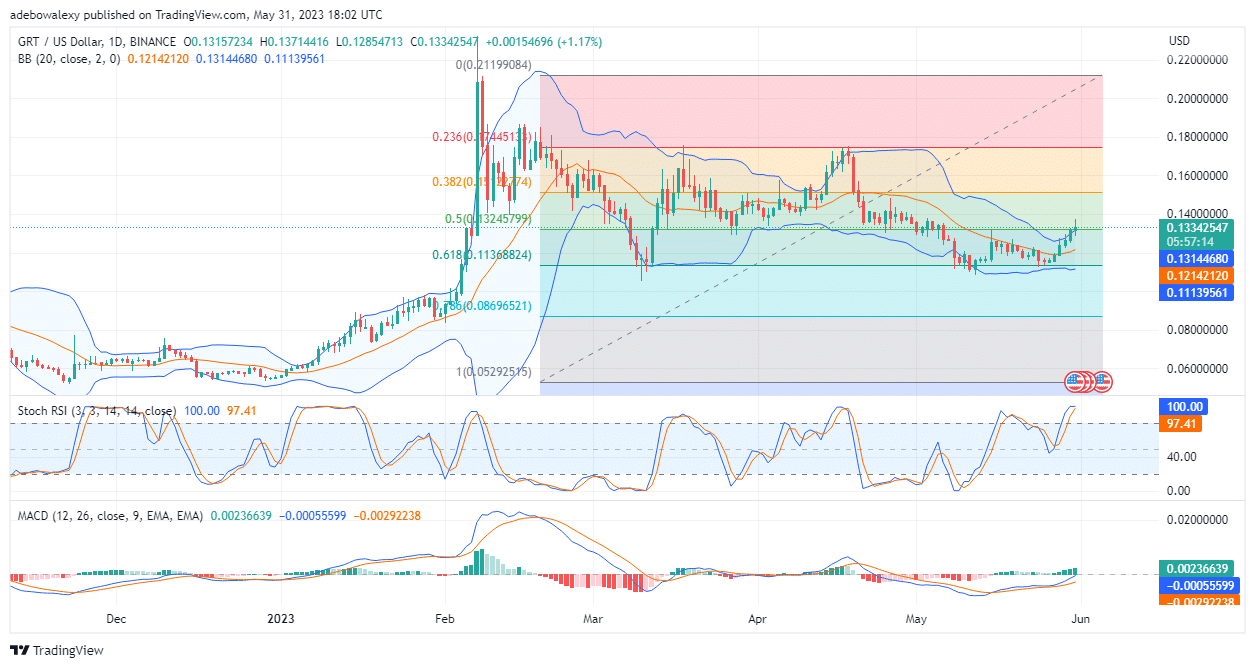
The Graph (GRT) Shows Readiness to Keep Going Northward
There has been a consistent price increase in the GRT daily chart, right after price action tested the support at $0.1137 on the 26th of May. As if now, price action has broken through the ceiling at the 0.1325 price mark. Furthermore, the Relative Strength Index (RSI) indicator’s leading line has reached the highest level of the indicator, while the lagging one is very close by at the 97.41 mark. Also, the last Moving Average Convergence Divergence indicator seems to be rising steeply at this point. Even the histogram bars of the MACD indicator are solid green and are growing longer. All the signs ensuing from technical indicators are predicting that the price action mark will rise further through the 0.1325 mark.
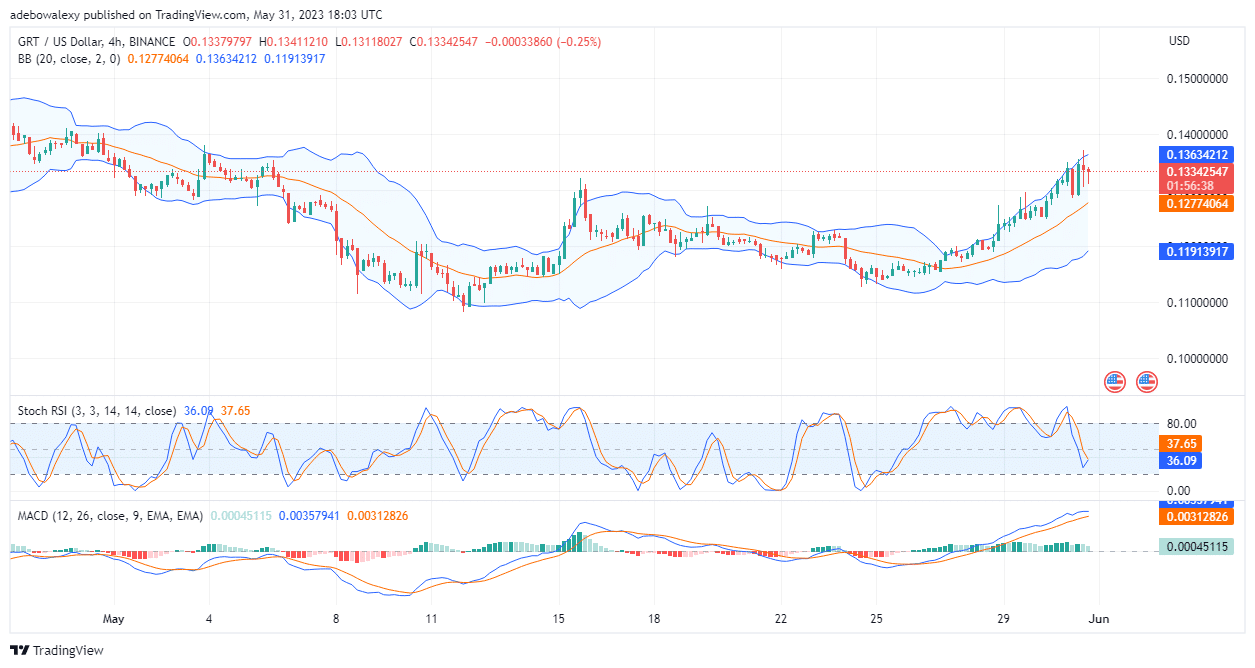
GRT Price Movements Stay Positive Despite the Activities of Downward Forces
On the GRT/USD 4-hour market, the activities of headwinds can be observed. This could be seen as two tiny red-price candles that have appeared recently on this market chart. Consequently, this has caused a minor downward retracement of the price. However, indications arising from technical indicators are hinting at a possible upside price retracement. The RSI curves are converging for a bullish crossover below the 40 mark. Meanwhile, the MACD lines are still rising after crossing above the equilibrium point of 0.00. However, it should be noted that the bars of the MACD are now pale green, which indicates a decrease in upside momentum. Despite that, price action seems to be heading towards the $0.1400 mark.
- Broker
- Min Deposit
- Score
- Visit Broker

- Award-winning Cryptocurrency trading platform
- $100 minimum deposit,
- FCA & Cysec regulated

- 20% welcome bonus of upto $10,000
- Minimum deposit $100
- Verify your account before the bonus is credited
- Fund Moneta Markets account with a minimum of $250
- Opt in using the form to claim your 50% deposit bonus
Learn to Trade
Never Miss A Trade Again

Signal Notification
Real-time signal notifications whenever a signal is opened, closes or Updated

Get Alerts
Immediate alerts to your email and mobile phone.

Entry Price Levels
Entry price level for every signal Just choose one of our Top Brokers in the list above to get all this free.