

The broader crypto market appears to be gradually edging toward a recovery. However, price action of the Sandbox token remains below key technical levels that would confirm a stronger bullish reversal. Below is a closer look at the SAND market.
SAND Statistics
Current Price: $0.0922
Market Capitalization: $241.99M
Circulating Supply: 2.66B
Total Supply: 3B
CoinMarketCap Rank: 124
Key Levels
Resistance: $0.0950, $0.1000, $0.1050
Support: $0.0900, $0.0850, $0.0800
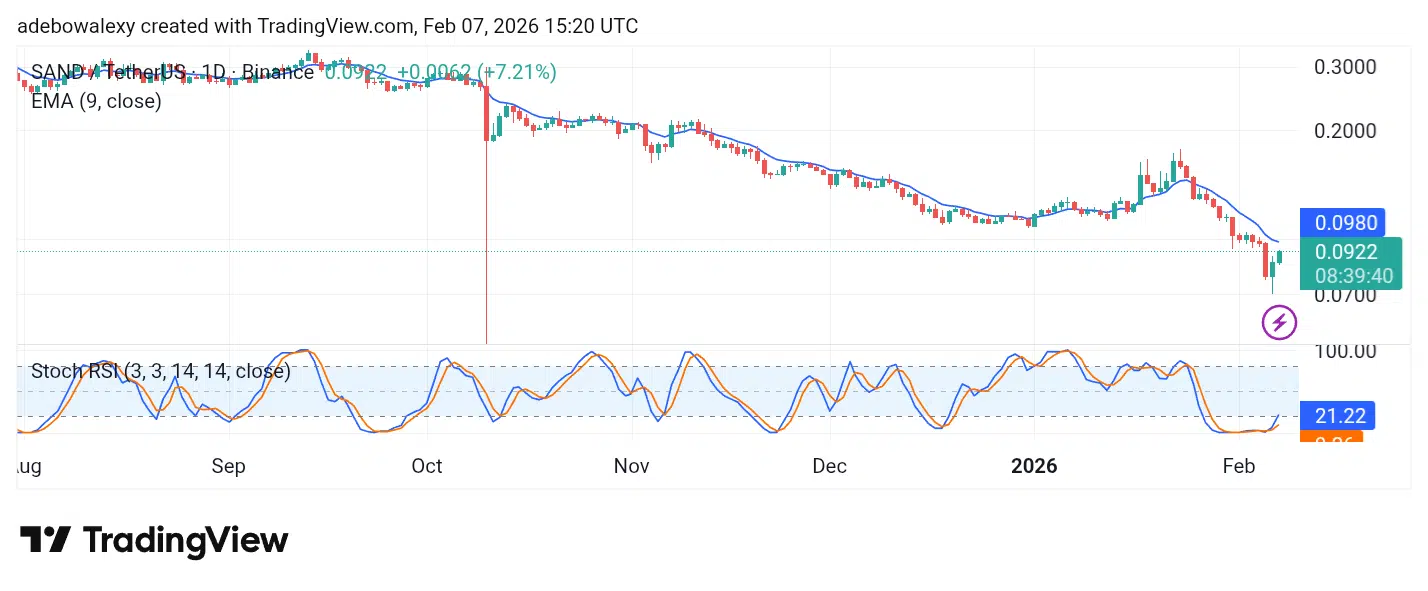
The Sandbox Stays Higher for the Second Consecutive Session
The SAND/USDT market initiated an upward rebound in the previous session, and this recovery has continued into the current session. Nevertheless, price action remains below the 9-day Exponential Moving Average (EMA).
The Sandbox Keeps a Dominant Stand Globally
The Winter Games have officially kicked off. The Sandbox makes its grand entrance, taking center stage in the global arena.
How many podium finishes will The Sandbox secure this season?
The Winter Games are here 🏟️
The Sandbox enters the stadium and steps onto the world stage.
How many podiums would The Sandbox claim this Winter Games? pic.twitter.com/gc7ebzHAy2
— The Sandbox (@TheSandboxGame) February 7, 2026
The Sandbox Stays Higher for the Second Consecutive Session ( Continued)
The ongoing session remains bullish and, so far, has not formed an upper shadow. Meanwhile, the Stochastic Relative Strength Index (SRSI) lines are rising from the oversold region, suggesting that the current rebound retains its strength.

SAND Appears Firm Above the 9-Day EMA
In the short term, the Sandbox market has edged above the 9-day EMA curve. The current session’s price candle has a long body and is positioned above the 9-day EMA.
Can $SAND Hit an All-Time High Again?
The Sandbox token is experiencing a sharp increase in trading volume, signaling growing bullish sentiment around the asset. The market is expanding and performing well, with price action currently trading around the $0.15 level.
SAND Appears Firm Above the 9-Day EMA (Continued)
At the same time, the SRSI lines continue to edge slightly higher after exiting the oversold region. However, the indicator lines are beginning to flatten, signaling a slowdown in bullish momentum. Despite this, the market may still have a chance to test the $0.1000 resistance level if price successfully rebounds off the 9-day EMA.
Make money without lifting your fingers: Start trading smarter today

