BNBUSD Price Analysis – December 19
The ability to break up the resistance level of $31 will expose the price to $33 and $37 price levels. In case the support level of $31 is defended by the bears, the price may reverse and continue its bearish movement towards the support levels of $29, $26 and $24.
BNB/USD Market
Key levels:
Supply levels: $31, $33, $37
Demand levels: $29, $26, $24
BNBUSD Long-term Trend: Bullish
BNBUSD is bullish on the long-term outlook. There was a bearish breakout that took place two weeks ago from the symmetrical triangle formed on the daily chart. The price tested the support level of $26 but unable to penetrate. A bullish engulfing candle formed and this triggered the bulls’ momentum. The price increases and $29 price level was broken upside. At the moment, the price is trying to break up the resistance level of $31.
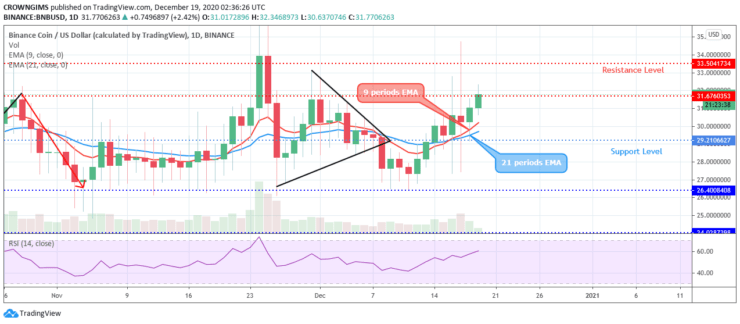
The 9 periods EMA is currently above the 21 periods EMA and the coin is trading above the two EMAs at a distance which indicates an increase in the bulls’ momentum. The ability to break up the resistance level of $31 will expose the price to $33 and $37 price levels. In case the support level of $31 is defended by the bears, the price may reverse and continue its bearish movement towards the support levels of $29, $26 and $24. The Relative Strength Index period 14 is bending up at 60 levels connotes buy signal.
BNBUSD medium-term Trend: Bullish
The bears were unable to break down the support level of $26 after the breakout that occurred from the triangle in the BNB market last two weeks. The bulls successfully defend the support level of $26 and the price bounces and rally towards the north. The resistance level of $29 could not hold the price, breaks it up and increases to $31 price level.
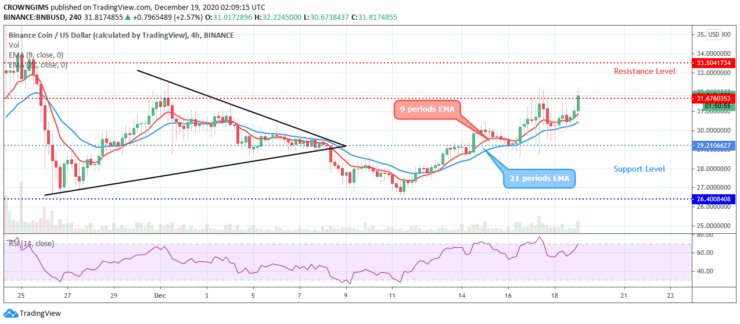
The 9 periods EMA has crossed the 21 periods EMA upside, and it is trading above the 9 periods EMA which indicates increase in the buyers’ pressure. Meanwhile, the relative strength index period 14 is at 70 levels pointing up to indicate a buy signal.
Note: Learn2.Trade is not a financial advisor. Do your research before investing your funds in any financial asset or presented product or event. We are not responsible for your investing results
- Broker
- Min Deposit
- Score
- Visit Broker

- Award-winning Cryptocurrency trading platform
- $100 minimum deposit,
- FCA & Cysec regulated

- 20% welcome bonus of upto $10,000
- Minimum deposit $100
- Verify your account before the bonus is credited
- Fund Moneta Markets account with a minimum of $250
- Opt in using the form to claim your 50% deposit bonus
Learn to Trade
Never Miss A Trade Again

Signal Notification
Real-time signal notifications whenever a signal is opened, closes or Updated

Get Alerts
Immediate alerts to your email and mobile phone.

Entry Price Levels
Entry price level for every signal Just choose one of our Top Brokers in the list above to get all this free.