Bitcoin SV Price Analysis – September 10
More pressure from the bears will push the price down to the previous low at $153 and in case it does not hold, the price may reduce to $134 and $130 price level. Should the bulls prevent the price reaching the $153 level, bullish momentum may continue and it will face barriers at $185, $198, and $217 resistance levels.
BSV/USD Market
Key Levels:
Resistance levels: $185, $198, $217
Support levels: $153, $134, $130
BSV/USD Long-term Trend: Bearish
BSV is bearish in the long-term outlook. The coin reached the support level at $153 on September 03 and the bearish pressure was not enough to break down the significant level of $153. The bulls defended the level and the price pulled back towards the two dynamic resistance levels (9 periods and 21 periods EMA). The bulls’ pressure is weak to penetrate the dynamic resistance level. The price may turn back and continue the bearish movement to retest the previous low at $153.
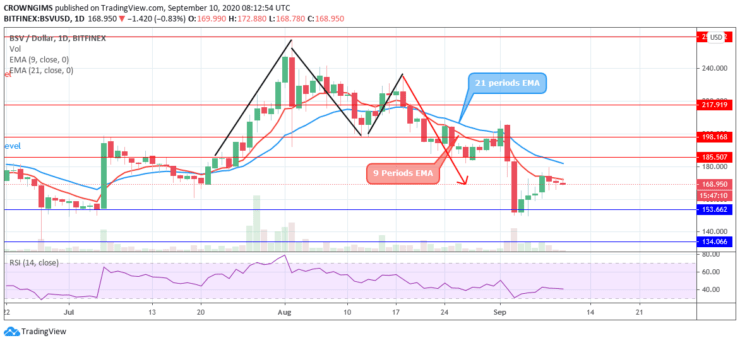
BSV price had a fake break up at 9- periods EMA on September 08 but could not maintain the momentum, the crypto is trading below the 9 periods EMA and 21 periods EMA as an indication that the bears are holding to the market. More pressure from the bears will push the price down to the previous low at $153 and in case it does not hold, the price may reduce to $134 and $130 price level. Should the bulls prevent the price reaching the $153 level, bullish momentum may continue and it will face barriers at $185, $198, and $217 resistance levels.
BSV/USD Medium-term Trend: Bearish
BSVUSD is bearish in the 4-hour chart. The bullish momentum that triggered at the support level of $153 could not push up the price to the nearest resistance level before it is exhausted. The price consolidates at $168 level yesterday. Today, it seems the bears are having the upper hand in the market. The price may fall to the support level at $153.

The 9 periods EMA is trying to cross the 21 periods EMA while the price is already below the two EMAs trying to establish the bearish movement. The relative strength index is bending down at 50 levels indicating a sell signal.
- Broker
- Min Deposit
- Score
- Visit Broker

- Award-winning Cryptocurrency trading platform
- $100 minimum deposit,
- FCA & Cysec regulated

- 20% welcome bonus of upto $10,000
- Minimum deposit $100
- Verify your account before the bonus is credited
- Fund Moneta Markets account with a minimum of $250
- Opt in using the form to claim your 50% deposit bonus
Learn to Trade
Never Miss A Trade Again

Signal Notification
Real-time signal notifications whenever a signal is opened, closes or Updated

Get Alerts
Immediate alerts to your email and mobile phone.

Entry Price Levels
Entry price level for every signal Just choose one of our Top Brokers in the list above to get all this free.