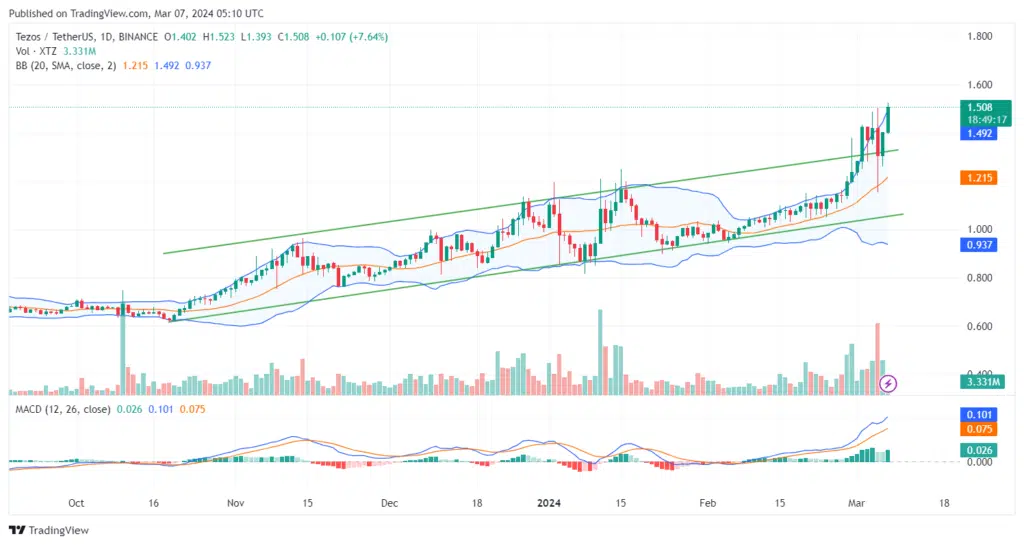
Studying the Tezos market, one can observe that the price action of this token has been in a clear uptrend. This is evident as price action continues to make higher lows along the upward-sloping price channel. However, it appears that the uptrend has intensified in recent times, and the token now trades outside the trendline. Let’s examine this market further.
Key Price Levels:
Resistance: $1.508, $1.600, and $1.700Support: $1.500, $1.400, and $1.300
Tezos Resumes Bullishness Above the Upside Sloping Trendline
As noted earlier, price action in the XTZ daily market has gained more bullish momentum. Here, it is evident that the coin now trades above the ceiling of the drawn price channel and the Bollinger Bands. Additionally, the last two sessions on this market were represented by large green price candles, further stressing that the bullish momentum here is significant.
Meanwhile, the Moving Average Convergence Divergence (MACD) indicator lines have taken a much steeper upside path. Likewise, the last bar of the indicator is now solid green, revealing growing momentum in the market.
XTZ Buyers Are Recording Consistent Gains
Now, looking at the Tezos 4-hour market, one can easily see that upside forces have been prevailing since the past three sessions until now. This was evident since the time when price action seemed to pick up a support above the ceiling of the drawn price channel. The ongoing session keeps the market further above the middle limit of the Bollinger Bands.
Nevertheless, one should note that the last price candle here has an upper shadow, indicating that downward forces are fighting back. However, the MACD’s bullish crossover stays intact, and the lines of the indicator continue to rise upward. Also, the last bar of the indicator is green in appearance, suggesting that traders can stick to crypto signals with targets near the $1.650 price level.
We use cookies to ensure that we give you the best experience on our website. If you continue to use this site we will assume that you are happy with it.