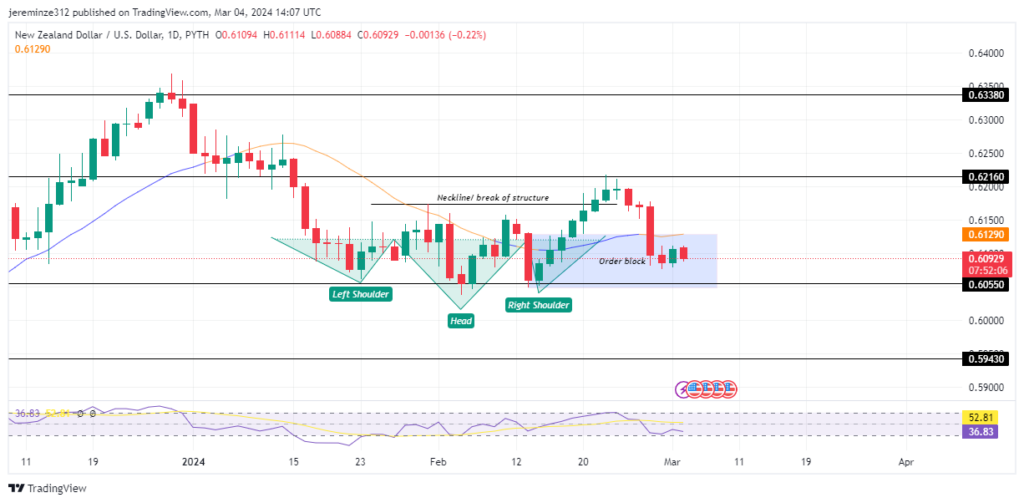
The NZDUSD price experiences a trend reversal. The NZDUSD market appears to be undergoing a reversal, marked by significant developments in recent price action. After reaching a notable peak at 0.63380 in late December, the currency pair experienced a downturn, finding support at the demand level of 0.60495.
NZDUSD Key Levels
Demand Zones: 0.62160, 0.63380
Supply Zones: 0.60495, 0.59430
NZDUSD Long-Term Trend: Bullish
The price action paused at the demand level of 0.60495, repeatedly testing it without breaking through. This consolidation phase led to the formation of a head-and-shoulders pattern, suggesting a potential reversal in the price trajectory.
The breakout above the pattern’s neckline and subsequent market structure shift indicate bullish momentum. However, a retracement towards the bullish order block is anticipated before further upward movement. Moreover, the Relative Strength Index (RSI) nearing the oversold territory at 30.0 signals potential bullish momentum. Oversold prices give optimal entries for buying amongst the best forex signals telegram groups.
NZDUSD Short-Term Trend: Bullish
On the 4-hour timeframe, the current price action shows consolidation, hinting at an impending bullish breakout. Concurrently, the RSI on this timeframe reinforces the bullish sentiment, nearing the overbought region around 70.0.
In summary, the NZDUSD currency pair demonstrates signs of a bullish reversal, supported by both long-term and short-term technical indicators. Traders may anticipate further upward movement, potentially preceded by a retracement towards established support levels.
Trade on MT4 with Leverage up to 1:500! Trade on MT4 with Leverage up to 1:500!
X
We use cookies to ensure that we give you the best experience on our website. If you continue to use this site we will assume that you are happy with it.

 NZDUSD Short-Term Trend: Bullish
 NZDUSD Short-Term Trend: Bullish


