

Sellers counter buyers in Sponge market
SPONGEUSDT Price Analysis – 21 November
Sponge levels of $0.000402 and $0.000502 could be investigated if the $0.000330 resistance level is breached higher. Bears can find support at $0.000196, $0.000269, and $0.000136 if the resistance level at $0.000330 holds.
SPONGE/USDT Market
Key levels:
Resistance levels: $0.000330, $0.000402, $0.000502
Support levels: $0.000196, $0.000269, $0.000136
SPONGEUSDT Long-term Trend: Bullish
On the daily chart, SPONGEUSDT is bullish. The price peaked at $0.000196 thanks in part to the increasing trend that started on October 28. A bullish harami candle appeared, allowing the bulls to break above the targeted level. Additional affirmative candles were lighted, and the SPONGE kept rising. It is currently up against the $0.000330 barrier after breaking through the upward $0.000196 barrier.
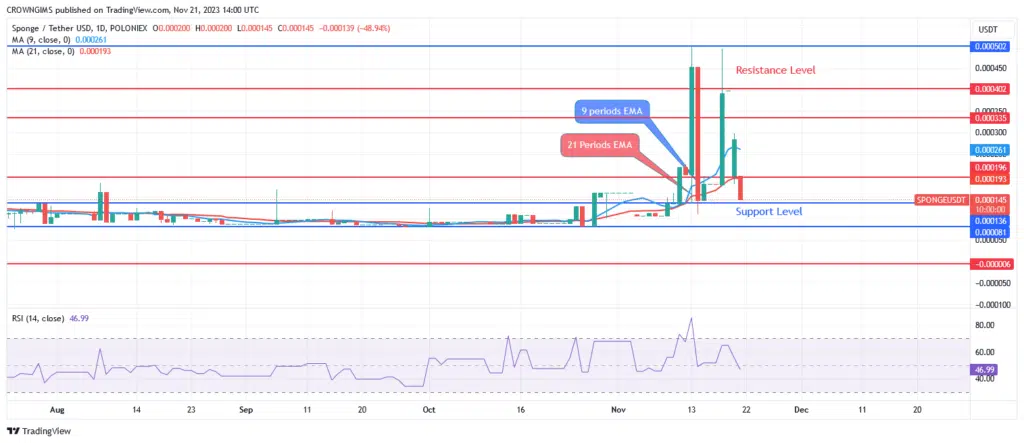
The SPONGE market is dominated by buyers. The crossover of the fast-moving average (9 periods) over the slow-moving average (21 periods EMA) indicates a positive trend, as long as the price stays above both EMAs. As long as the bulls keep moving forward, the bullish trend could continue. The price levels of $0.000402 and $0.000502 could be investigated if the $0.000330 resistance level is breached higher. Bears can find support at $0.000196, $0.000269, and $0.000136 if the resistance level at $0.000330 holds.
SPONGEUSDT medium-term Trend: Bullish
On the 4-hour SPONGEUSDT chart, there is an upward trend. Last week, buyers dominated the Sponge market. As pressure on the bulls increased over time, the bullish trend held. After testing, the $0.000196 resistance level was broken upwards. The increased pressure from the bulls is pushing the price in the direction of the $0.000330 resistance level.

The fact that the Crypto is trading above the 9- and 21-period EMAs and that the fast EMAs are above the slow EMAs indicates a bullish market. The signal lines are bending higher to suggest a buy signal, and the relative strength index period 14 is at 38 levels.
Invest in the hottest and best meme coin. Buy Sponge ($SPONGE) today!


