Buyers are prevailing in Sponge market
SPONGEUSDT Price Analysis – 22 November
In the case that the $0.000330 resistance level is broken higher, the price levels of $0.000402 and $0.000502 could be examined. Support for bears is located at $0.000196, $0.000269, and $0.000136 if the $0.000330 resistance level holds.
SPONGE/USDT Market
Key levels:
Resistance levels: $0.000330, $0.000402, $0.000502
Support levels: $0.000196, $0.000269, $0.000136
SPONGEUSDT Long-term Trend: Bullish
The SPONGEUSDT daily chart shows bullishness. The price increased steadily beginning on October 28 and reached a peak of $0.000196. The bulls were able to break above the desired level as a bullish engulfing candle emerged. More positive candles were lit, and the SPONGE continued to rise. It broke through the upward $0.000196 barrier and is now up against the $0.000330 barrier.
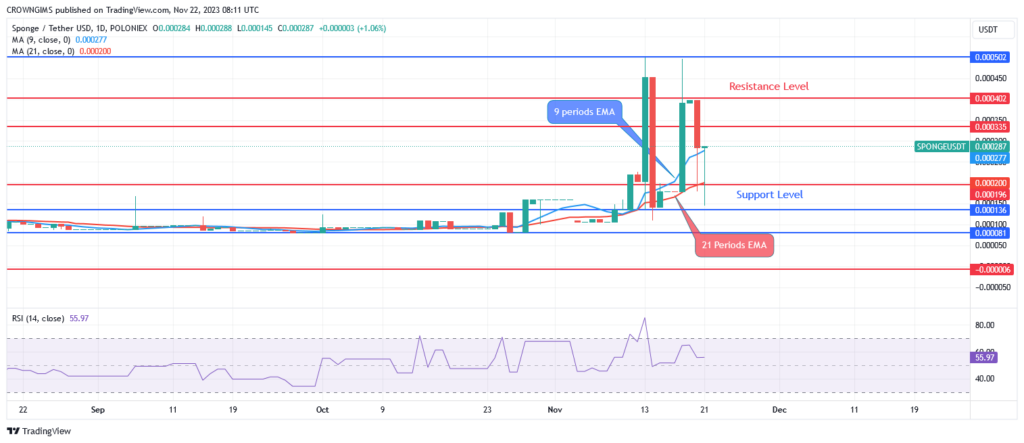
The market for SPONGE is dominated by purchasers. As long as the price remains above both EMAs, the crossover of the fast-moving average (9 periods) over the slow-moving average (21 periods EMA) denotes a positive trend. The positive trend may hold as long as the bulls continue to advance. In the case that the $0.000330 resistance level is broken higher, the price levels of $0.000402 and $0.000502 could be examined. Support for bears is located at $0.000196, $0.000269, and $0.000136 if the $0.000330 resistance level holds.
SPONGEUSDT medium-term Trend: Bullish
The 4-hour SPONGEUSDT chart is trending upward. The Sponge market was dominated by buyers last week. The bullish trend held as pressure on the bulls mounted over time. The $0.000196 resistance level was broken upward following testing. The price is moving toward the $0.000330 resistance level as a result of the bulls’ intensified pressure.
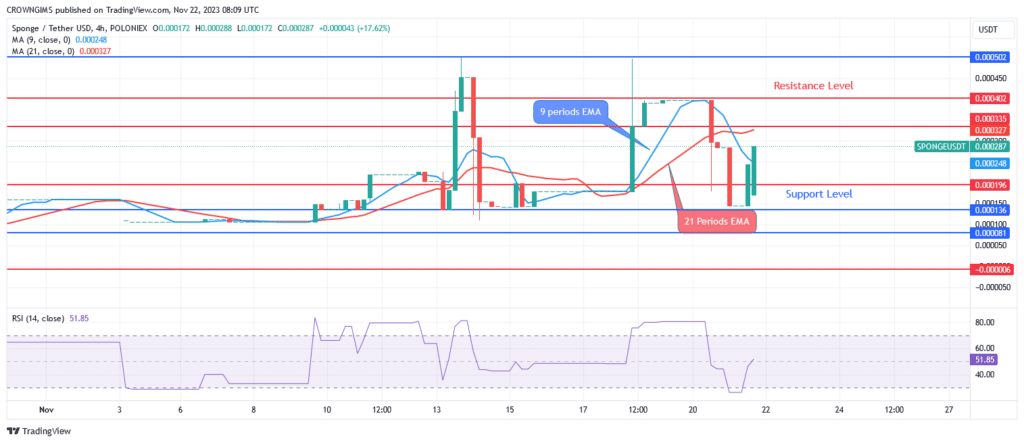
A bullish market is indicated by the fact that the Crypto is trading above the 9- and 21-period EMAs and that the fast EMAs are above the slow EMAs. The relative strength index period 14 is at 38 levels, and the signal lines are bending higher to imply a buy signal.
Invest in the hottest and best meme coin. Buy Sponge ($SPONGE) today!
- Broker
- Min Deposit
- Score
- Visit Broker

- Award-winning Cryptocurrency trading platform
- $100 minimum deposit,
- FCA & Cysec regulated

- 20% welcome bonus of upto $10,000
- Minimum deposit $100
- Verify your account before the bonus is credited
- Fund Moneta Markets account with a minimum of $250
- Opt in using the form to claim your 50% deposit bonus
Learn to Trade
Never Miss A Trade Again

Signal Notification
Real-time signal notifications whenever a signal is opened, closes or Updated

Get Alerts
Immediate alerts to your email and mobile phone.

Entry Price Levels
Entry price level for every signal Just choose one of our Top Brokers in the list above to get all this free.