Bullish momentum may persist in Sponge market
Bullish momentum may persist in Sponge market as long as the bulls maintain their pressure. It is possible to try the price levels of $0.000330 and $0.000402 if the $0.000196 resistance level is broken upside. If the resistance level of $0.000196 persists, bears may find support at $0.000136, $0.000081, and $0.000006.
SPONGE/USDT Market
Key levels:
Resistance levels: $0.000196, $0.000330, $0.000402
Support levels: $0.000136, $0.000081, $0.000006
SPONGEUSDT Long-term Trend: Bullish
The SPONGEUSDT daily chart shows bullishness. The upward trend that began on October 28 has allowed the price to peak at $0.000196. The bulls were able to break above the stated level as a bullish harami candle emerged. More positive candles were lit, and the SPONGE continued to rise. After breaking through the upward $0.000196 barrier, it is currently retreating to retest the $0.000136 level.
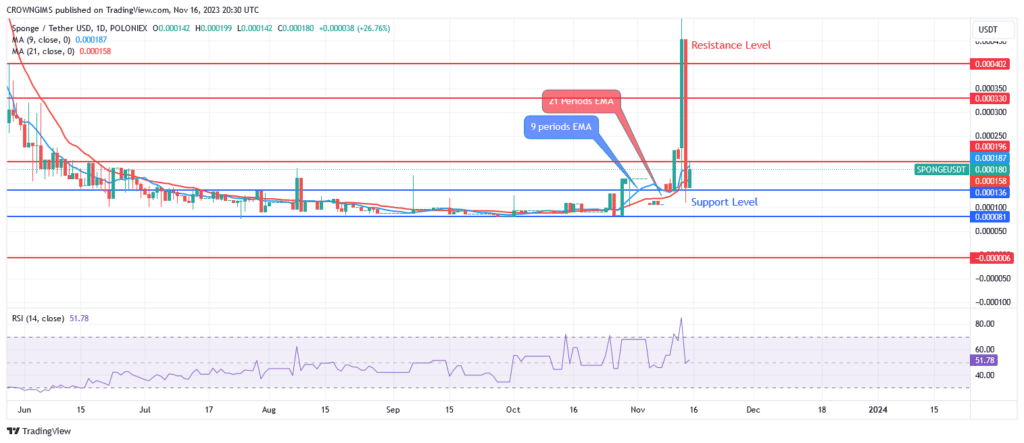
Buyers are fighting for supremacy in the SPONGE market. Price trading above both EMAs suggests a bullish trend as it signifies the crossing of the fast-moving average (9 periods) over the slow-moving average (21 periods EMA). The bullish momentum may persist as long as the bulls maintain their pressure. It is possible to try the price levels of $0.000330 and $0.000402 if the $0.000196 resistance level is broken upside. If the resistance level of $0.000196 persists, bears may find support at $0.000136, $0.000081, and $0.000006.
SPONGEUSDT medium-term Trend: Bullish
The 4-hour chart of SPONGEUSDT is positive. Buyers ruled the Sponge market last week. The positive trend held as the pressure on the bulls grew over time. The $0.000196 resistance level was tested. Because the bulls were able to exert more pressure, the price is currently leaning toward the $0.000196 resistance level.
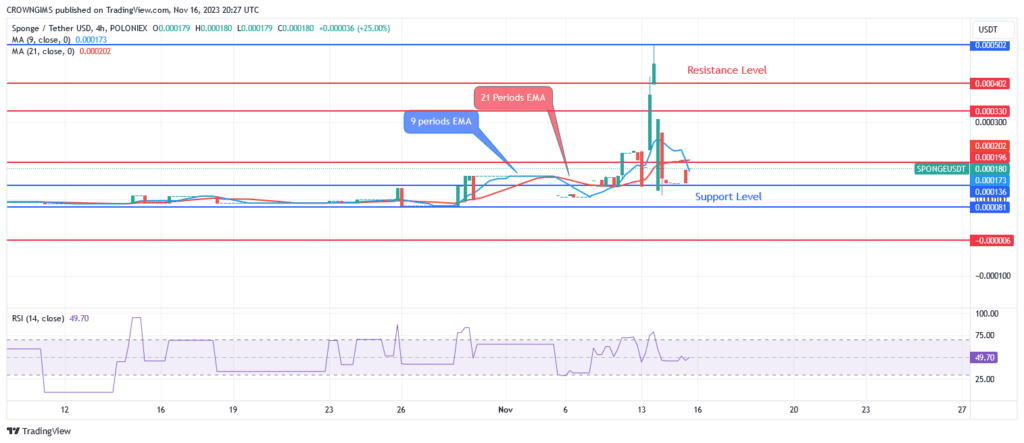
A bullish market is indicated by the currency pair’s trading above the 9- and 21-period EMAs, and the fast EMAs are above the slow EMAs. The relative strength index period 14 is at 51 levels, and the signal lines are bending up to indicate a buy signal.
Invest in the hottest and best meme coin. Buy Sponge ($SPONGE) today!
- Broker
- Min Deposit
- Score
- Visit Broker

- Award-winning Cryptocurrency trading platform
- $100 minimum deposit,
- FCA & Cysec regulated

- 20% welcome bonus of upto $10,000
- Minimum deposit $100
- Verify your account before the bonus is credited
- Fund Moneta Markets account with a minimum of $250
- Opt in using the form to claim your 50% deposit bonus
Learn to Trade
Never Miss A Trade Again

Signal Notification
Real-time signal notifications whenever a signal is opened, closes or Updated

Get Alerts
Immediate alerts to your email and mobile phone.

Entry Price Levels
Entry price level for every signal Just choose one of our Top Brokers in the list above to get all this free.