Bearish pressure may increase in S&P 500 market
S&P 500 Price Analysis – 20 December
In case the momentum of the sellers increase, S&P 500 may break down the support level of $3740, and a further increase in sellers’ pressure may reduce the price to $3649 and $3493 levels. Should the support level of $3740 holds, the price can reverse and increase toward the resistance levels of $3926, $4087, and $4169.
Key levels:
Resistance levels: $3926, $4087, $4169
Support levels: $3740, $3649, $3493
S&P 500 Long-term trend: Bearish
S&P 500 is bearish on the daily chart. The bulls could not maintain their momentum when the price reached the resistance level of $4087. A small double-top chart pattern formed at the mentioned level; is an indication that sellers are ready to dominate the market. The sellers’ pressure increased and the price penetrated the support level of $3926. It is currently targeting the support level of $3740.
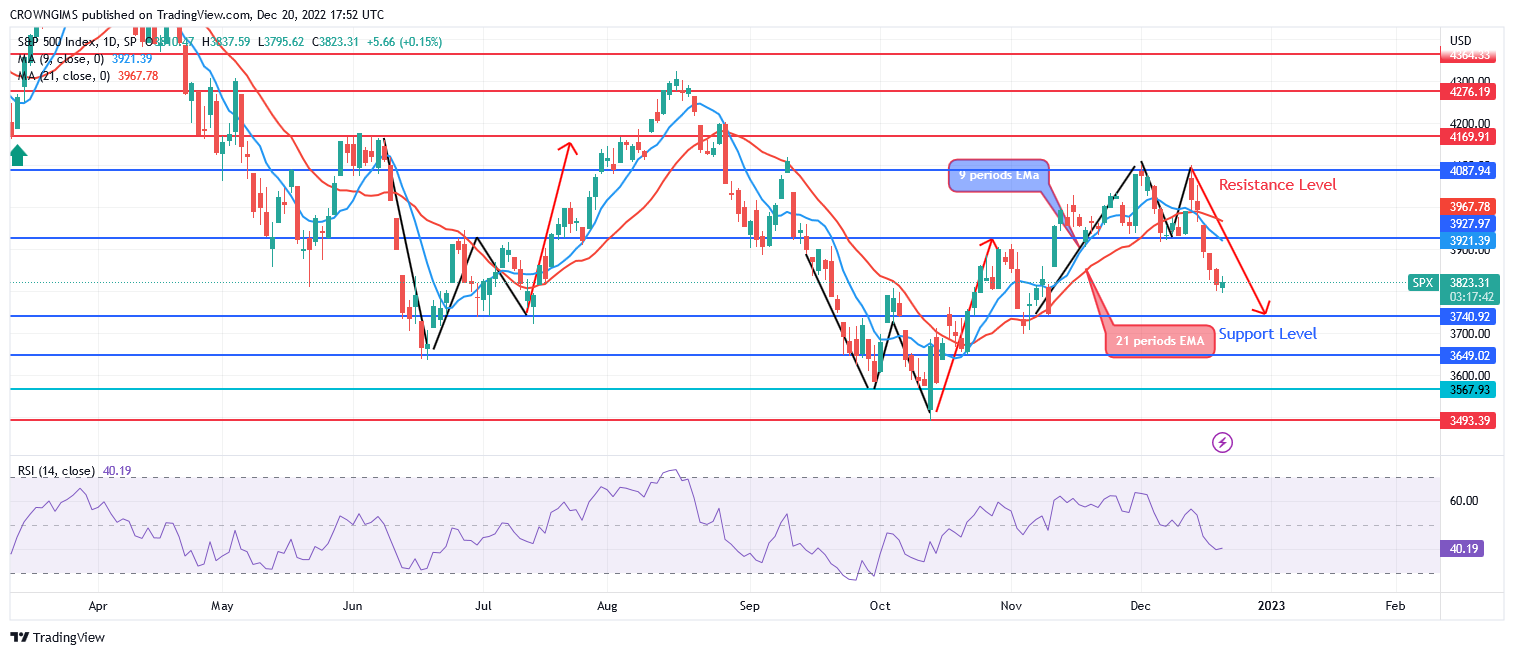
S&P 500 is trading below the 9-periods EMA and the 21-period EMA which indicates bearish momentum. In case the momentum of the sellers increase, S&P 500 may break down the support level of $3740, and a further increase in sellers’ pressure may reduce the price to $3649 and $3493 levels. Should the support level of $3740 holds, the price can reverse and increase toward the resistance levels of $3926, $4087 and $4169. The relative strength index period 14 is at 40 levels with the signal line pointing down to indicate a sell signal.
S&P 500 Medium-term Trend: Bearish
S&P 500 is on a bearish movement in the 4-hour chart outlook. The price action formed an “M” chart pattern in the 4-hour time frame. The price increased to the resistance level of $4087. It pulled back to retest the support level of $3937, the just mentioned level holds. The price is obeying the command from the bearish chart pattern formed. 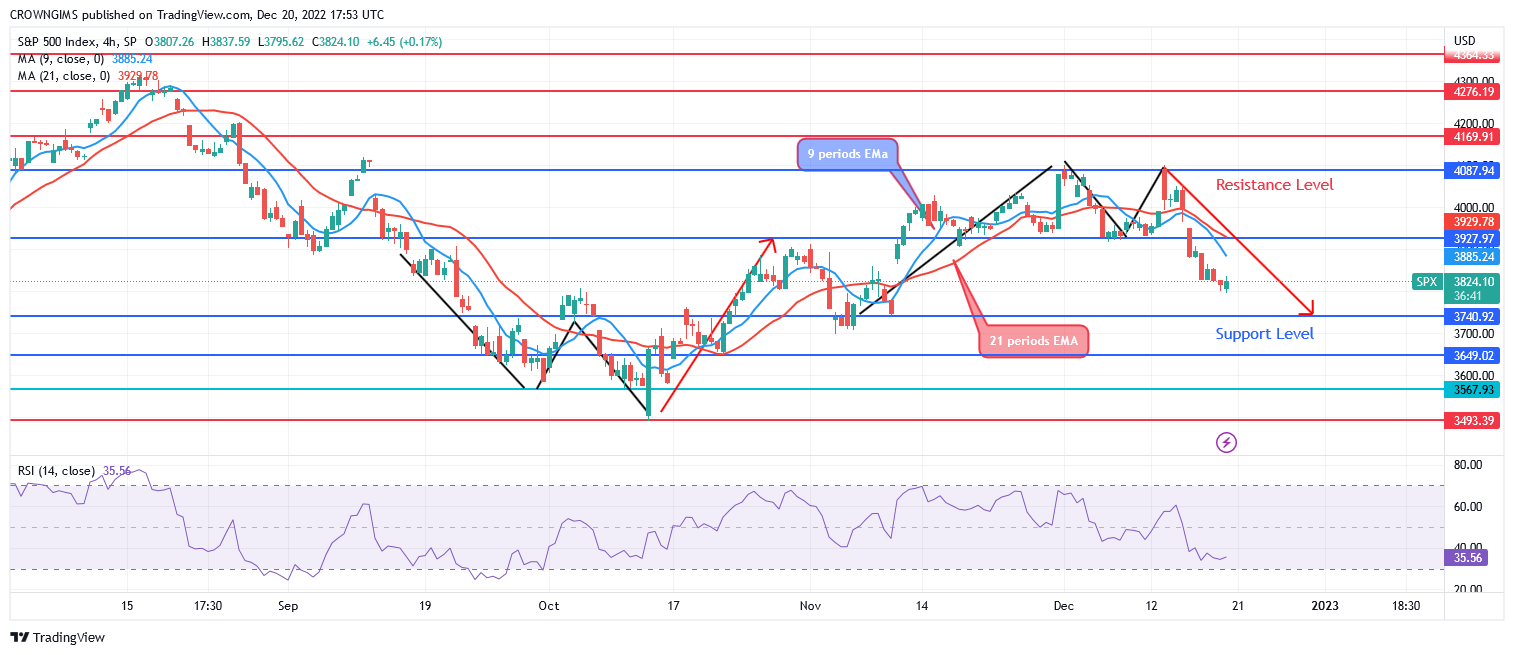
The price is trading below the 9-periods EMA and 21-periods EMA as an indication of bearish movement. The relative strength index period 14 is at 35 levels displaying a bearish signal.
You can purchase Lucky Block – Guide, Tips & Insights | Learn 2 Trade here. Buy LBLOCK
- Broker
- Min Deposit
- Score
- Visit Broker

- Award-winning Cryptocurrency trading platform
- $100 minimum deposit,
- FCA & Cysec regulated

- 20% welcome bonus of upto $10,000
- Minimum deposit $100
- Verify your account before the bonus is credited
- Fund Moneta Markets account with a minimum of $250
- Opt in using the form to claim your 50% deposit bonus
Learn to Trade
Never Miss A Trade Again

Signal Notification
Real-time signal notifications whenever a signal is opened, closes or Updated

Get Alerts
Immediate alerts to your email and mobile phone.

Entry Price Levels
Entry price level for every signal Just choose one of our Top Brokers in the list above to get all this free.