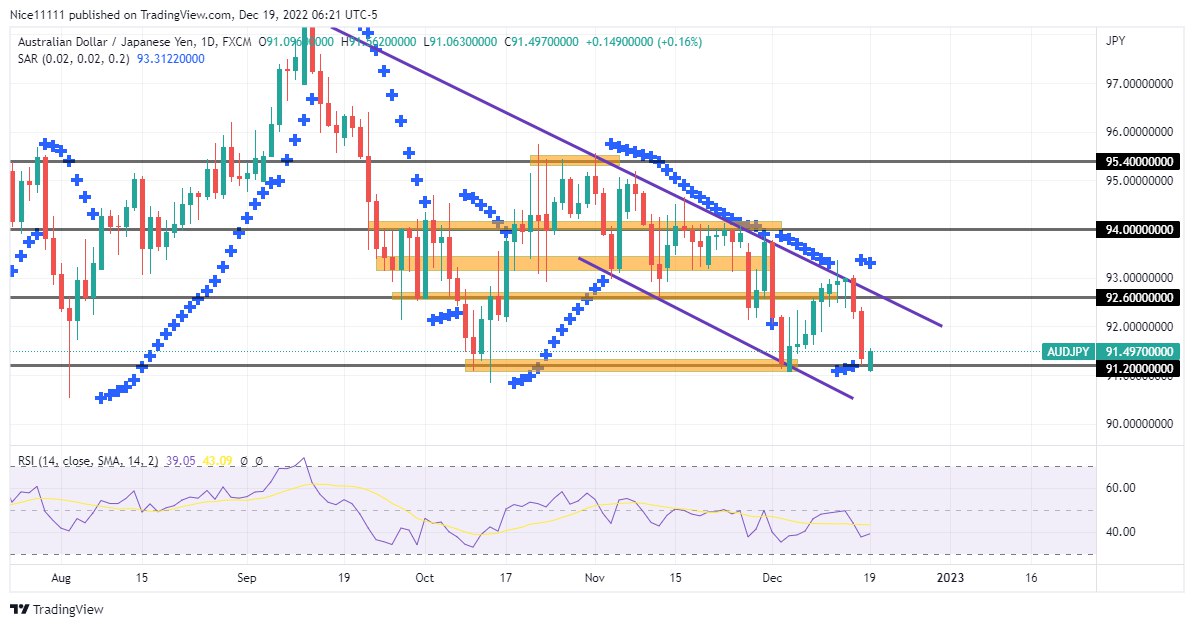
AUDJPY continues to respect the bearish channel on the daily chart. Sellers are obviously in control as there is a continuous price decline.
AUDJPY Major Levels
Demand zones: 91.20, 90.50, 90.00
Support zones: 92.60, 94.00, 95.40
AUDJPY Long-term Trend: Bearish
The market took off suddenly as August opened. A prominent rejection candle appeared at the 92.20 demand level. A long wick seen under the daily candle revealed the buying force at the support level. The Parabolic SAR (Stop and Reverse) guided the daily candles through various supply levels to rest above 95.40. The market was oversold above the 95.40 supply level. The appearance of the Parabolic SAR was a confirmation of a trend reversal. The market crashed back to 91.20.
The market bounced off the demand level at 91.20 in October. Other major levels except 95.40 were not respected as the price rose. The level formed a confluence point with the daily bearish trendline. The market reversed at the touch of the confluence point of the bearish trendline and the supply level at 95.400. The downward parallel channel on the daily chart has conducted the market to the demand level at 92.20.
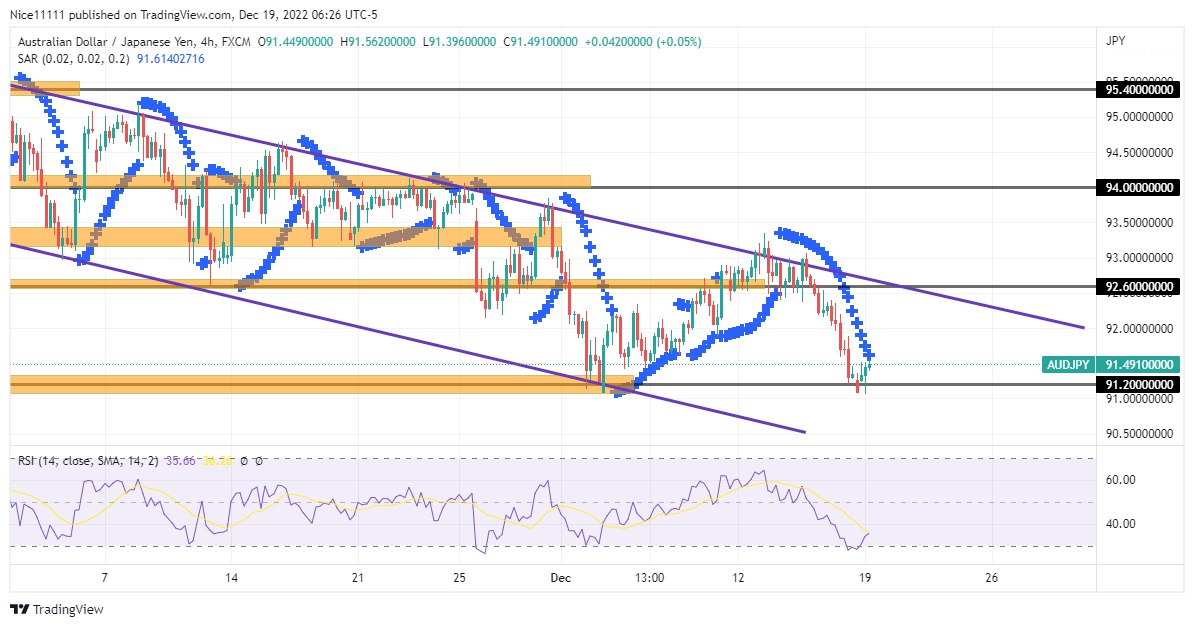
AUDJPY Short-term Trend: Bearish
The market structure shows the weakness of the lows formed. Lower highs and lows are evident in the bearish parallel channel to reach the demand level at 91.20. The market is currently bearish. A retracement is expected to shift the market to 92.60 before the downward order flow continues.
You can purchase Lucky Block – Guide, Tips & Insights | Learn 2 Trade here. Buy LBLOCK
Note: Learn2.trade is not a financial advisor. Do your research before investing your funds in any financial asset or presented product or event. We are not responsible for your investing results.
Trade on MT4 with Leverage up to 1:500! Trade on MT4 with Leverage up to 1:500!
X
We use cookies to ensure that we give you the best experience on our website. If you continue to use this site we will assume that you are happy with it.