S&P 500 price may reach $4476 level
S&P 500 Price Analysis – 13 June
As buying pressure increases, the S&P 500 may break through the $4364 resistance level, and further buying could drive the price up to the $4476 and $4631 levels. The price may revert and fall in the direction of the support levels of $4276, $4180, and $4087 if the $4364 resistance level is held.
Key Levels:
Resistance levels: $4364, $4476, $4631
Support levels: $4276, $4180, $4087
S&P 500 Long-term trend: Bullish
On the daily chart, the S&P 500 is moving in a bullish trend. On March 9, the $3927 level of support was breached. Since there was little to no selling pressure, it was unable to touch the $3740 support level. We complied with the client’s request to increase the pressure on pricing. The price rose from March 16 till it hit its peak of $4180. Past the dynamic resistance level, the price rises. The $4180 boundary was broken by strong buying pressure, and the $4276 level was broken upward and the price is currently testing the resistance level of $4364.
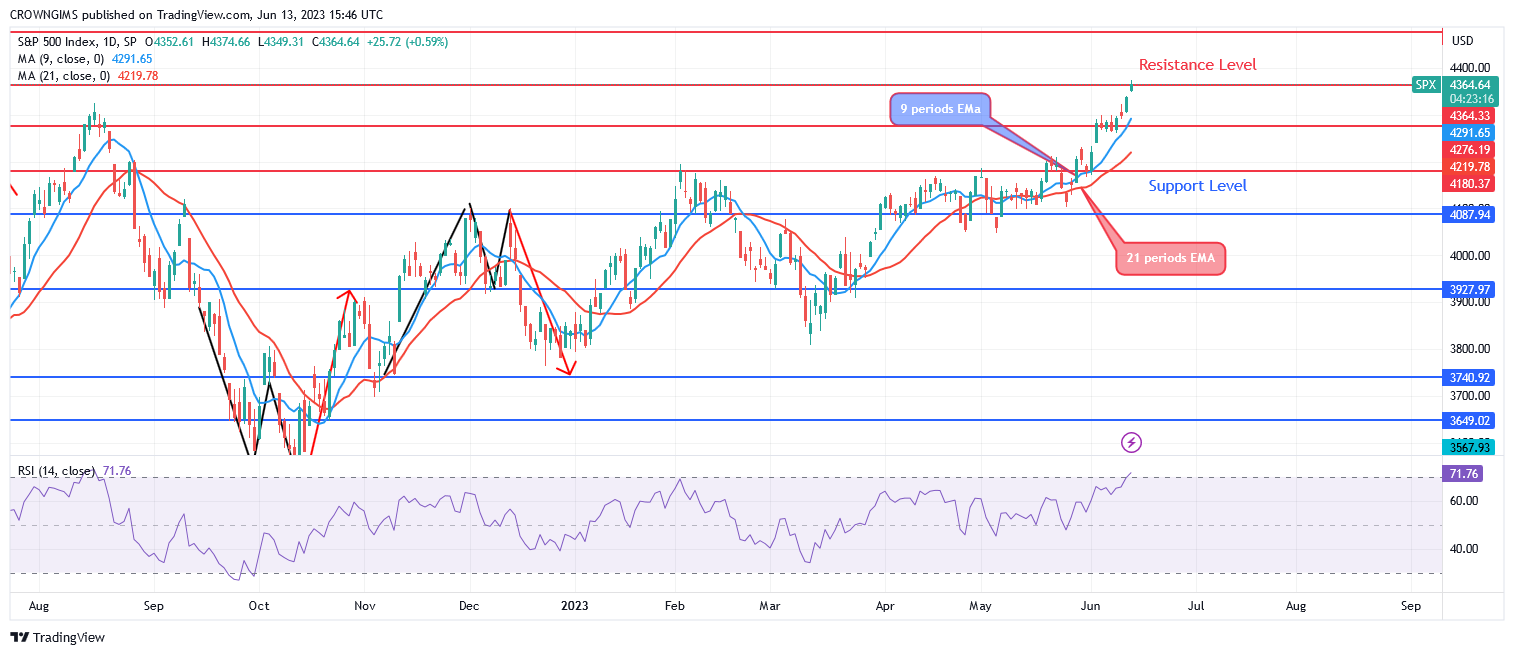
As buying pressure increases, the S&P 500 may break through the $4364 resistance level, and further buying could drive the price up to the $4476 and $4631 levels. The price may revert and fall in the direction of the support levels of $4276, $4180, and $4087 if the $4364 resistance level is held. The relative strength index period 14 is at 72 and the signal line pointing upward indicates a buy signal.
S&P 500 Medium-term Trend: Bullish
S&P 500 is in the bullish direction in the 4-hour chart. By holding the $3927 barrier level, the purchasers were able to stop the price of the S&P 500 from falling much. The price started to rise as soon as it crossed the $4087 support level as purchasing pressure began to build. The $4180 psychological barrier was in sight as the price increased. When buyer pressure mounted, the $4180 threshold level was crossed. At the moment, it’s trying to go past the $4364 mark.
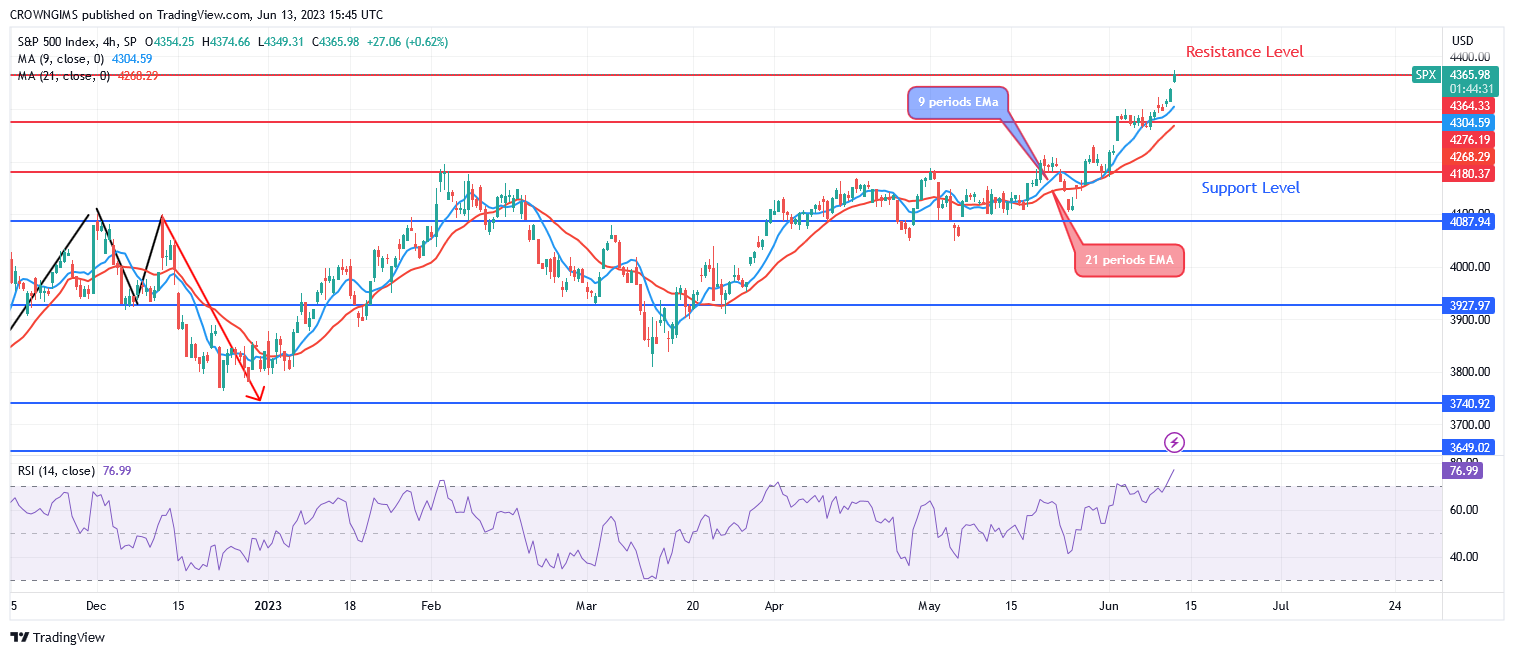
Both the 9-period and 21-period exponential moving averages are currently being traded above by the S&P 500 price. A positive signal can be seen on the Relative Strength Index period 14 at level 77.
You can purchase Lucky Block – Guide, Tips & Insights | Learn 2 Trade here. Buy LBLOCK
- Broker
- Min Deposit
- Score
- Visit Broker

- Award-winning Cryptocurrency trading platform
- $100 minimum deposit,
- FCA & Cysec regulated

- 20% welcome bonus of upto $10,000
- Minimum deposit $100
- Verify your account before the bonus is credited
- Fund Moneta Markets account with a minimum of $250
- Opt in using the form to claim your 50% deposit bonus
Learn to Trade
Never Miss A Trade Again

Signal Notification
Real-time signal notifications whenever a signal is opened, closes or Updated

Get Alerts
Immediate alerts to your email and mobile phone.

Entry Price Levels
Entry price level for every signal Just choose one of our Top Brokers in the list above to get all this free.