Price may further increase in S&P 500 market
S&P 500 Price Analysis – 13 December
When the momentum of the buyers increases, S&P 500 may break up the resistance level of $4087, and further increase envisaged towards $4169 and $4276 levels. The support level of $3937 can be penetrated if sellers increase their pressure, then, support level of $3740, and $3640 may be tested. The relative strength index period 14 is at 56 levels with the signal lines pointing up to indicate buy signal.
Key levels:
Resistance levels: $4087, $4169, $4276
Support levels: $3937, $3740, $3649
S&P 500 Long-term trend: Bullish
S&P 500 is bullish on the daily chart. The bulls maintain their position in the S&P 500 market but there was low volatility in the S&P 500 last week. S&P 500 continues trading within the resistance level of $4087 and support level of $3937. The bulls are yet to gain enough pressure to break up the mentioned resistance level. Likewise, the bears made an attempt to break down the support level of $3937 but the bulls defended the mentioned level. At the moment, the price is trading with the $ 3937 and $4087 levels.
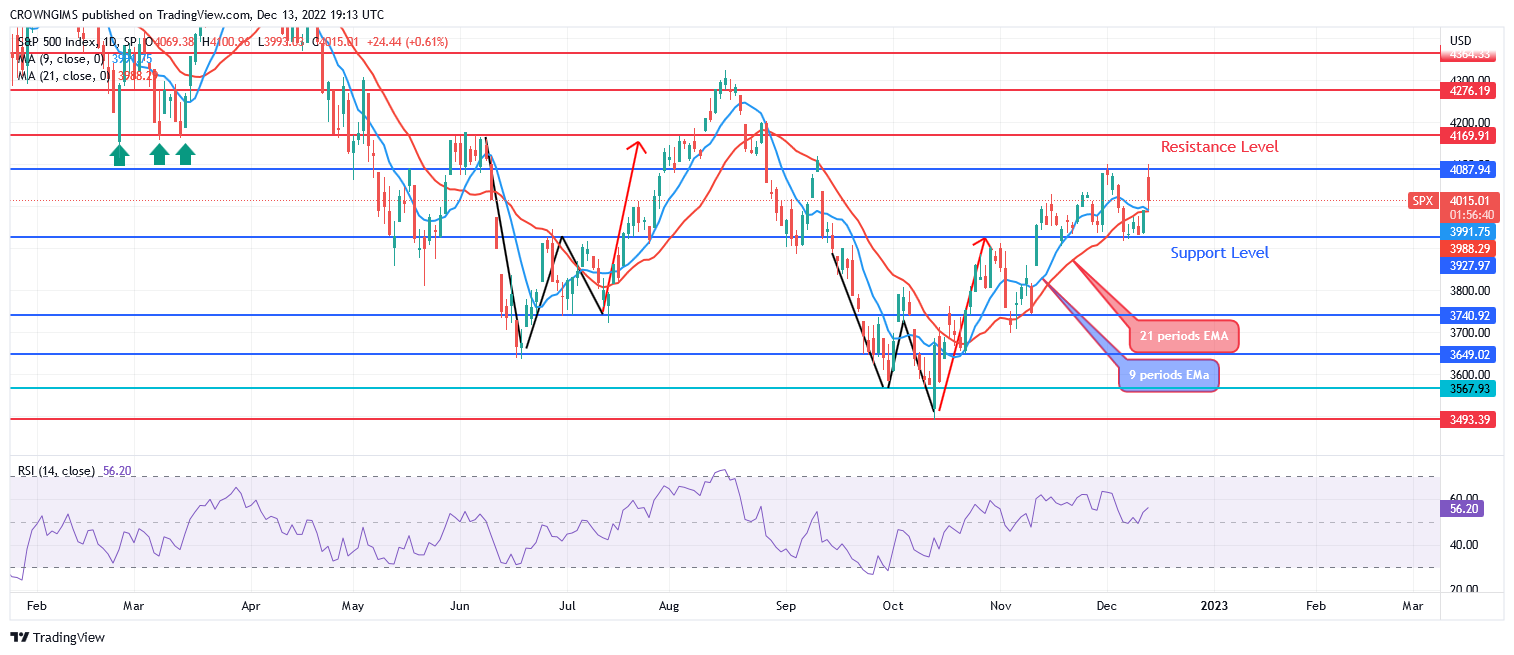
S&P 500 is trading slightly above the 9-periods EMA and the 21-period EMA which indicate a bullish momentum. When the momentum of the buyers increases, S&P 500 may break up the resistance level of $4087, and a further increase is envisaged towards $4169 and $4276 levels. The support level of $3937 can be penetrated if sellers increase their pressure, then, a support level of $3740, and $3640 may be tested. The relative strength index period 14 is at 56 levels with the signal lines pointing up to indicate a buy signal.
S&P 500 Medium-term Trend: Bullish
S&P 500 is on a bullish movement in the 4-hour chart outlook. Last two weeks, the price increased to the resistance level of $4087. It pulled back to retest the support level of $3937, the just mentioned level holds. There was a short period of consolidation at the $3937 level. Last week, the price increased again and the resistance level of $4087 was retested.
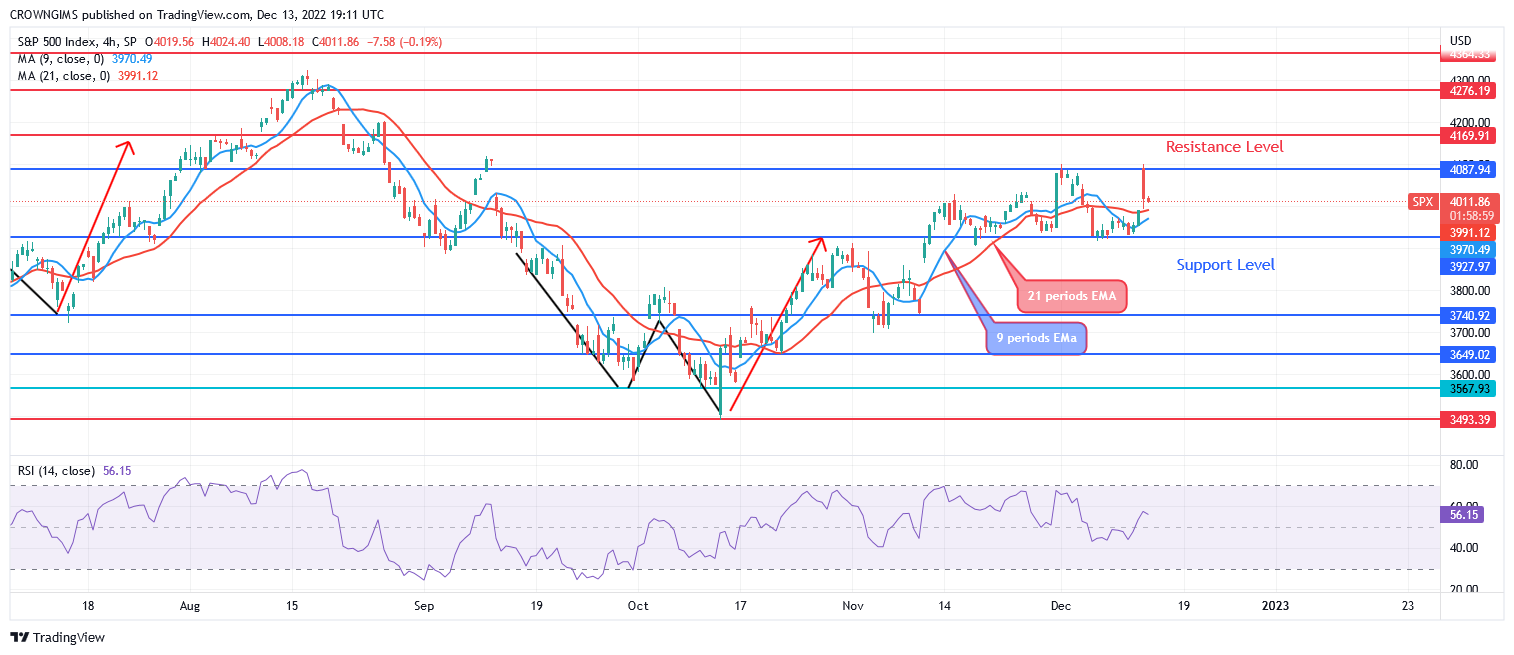
The price is trading above the 9-periods EMA and 21-periods EMA as an indication of bullish movement. The relative strength index period 14 is at 57 levels displaying a bullish signal.
You can purchase Lucky Block – Guide, Tips & Insights | Learn 2 Trade here. Buy LBLOCK
- Broker
- Min Deposit
- Score
- Visit Broker

- Award-winning Cryptocurrency trading platform
- $100 minimum deposit,
- FCA & Cysec regulated

- 20% welcome bonus of upto $10,000
- Minimum deposit $100
- Verify your account before the bonus is credited
- Fund Moneta Markets account with a minimum of $250
- Opt in using the form to claim your 50% deposit bonus
Learn to Trade
Never Miss A Trade Again

Signal Notification
Real-time signal notifications whenever a signal is opened, closes or Updated

Get Alerts
Immediate alerts to your email and mobile phone.

Entry Price Levels
Entry price level for every signal Just choose one of our Top Brokers in the list above to get all this free.