Cardano market awaiting a breakout
ADA Price Analysis – 13 December
Should the buyers gain more momentum, Cardano will increase and may break up the resistance level of $0.31, also, the resistance level of $0.33 may be penetrated and the resistance level of $0.35 may be reached. When the sellers exert more pressure to break down the $0.29 support level, this may lead to a further decrease in price to support levels of $0.22, and $0.18.
ADA/USD Market
Key Levels:
Resistance levels: $0.31, $0.33, $0.35
Support levels: $0.29, $0.22, $0.18
ADA/USD Long-term Trend: Ranging
Cardano is ranging on a daily chart. There is a low volatility in the Cardano market; this scenario started when the price tested the support level of $0.29 on 21 November. The bears’ momentum becomes low and unable to push the price below that support level. The bulls tried to push the price above the resistance level of $0.31 but the bears defends the level. This is what led to the ranging movement within the $0.31 and $0.29 levels.
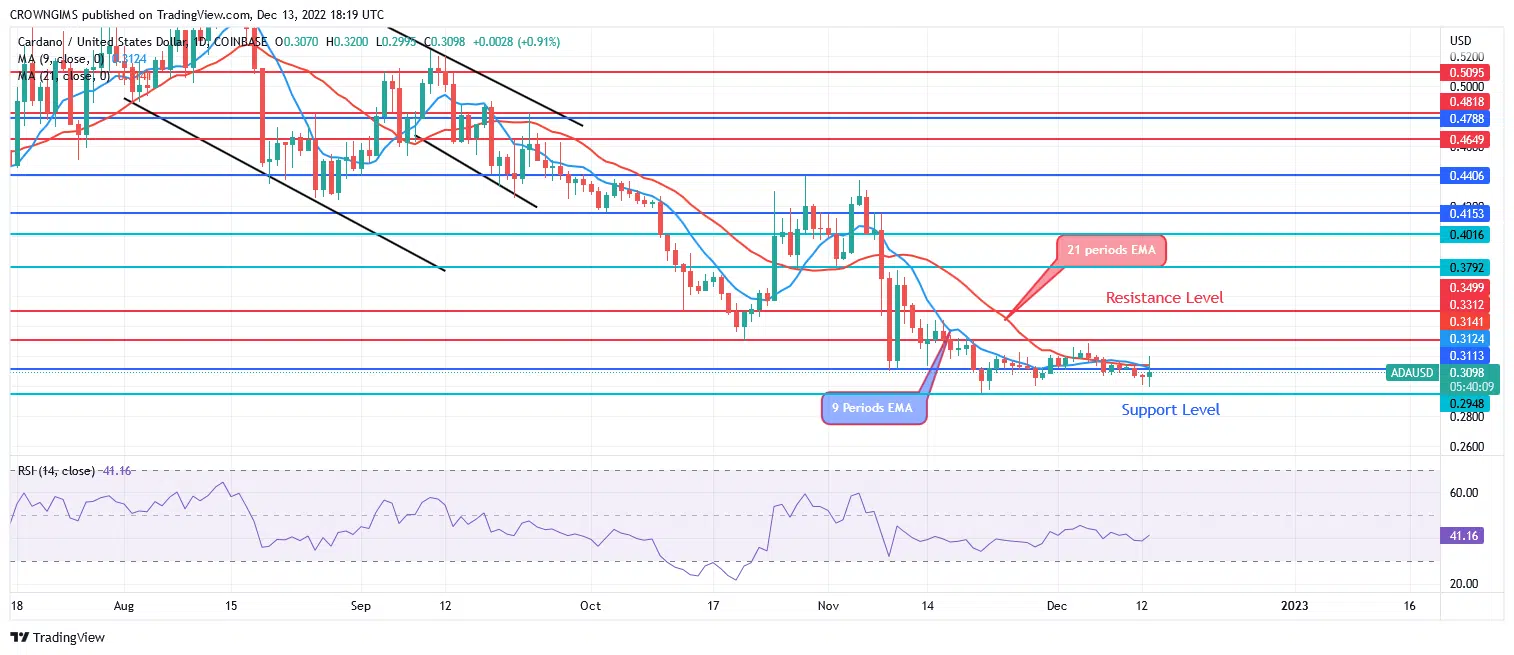
Cardano is trading around the dynamic support levels and it is hovering over the 9-periods EMA and 21-periods EMA. Should the buyers gain more momentum, price will increase and may break up the resistance level of $0.31, also, the resistance level of $0.33 may be penetrated and the resistance levels of $0.35 may be reached. When the sellers exert more pressure to break down the $0.29 support level, this may lead to a further decrease in price to support levels of $0.22, and $0.18. The technical indicator Relative Strength Index period 14 is at 41 levels with the signal line displaying no specific direction.
ADA/USD Medium-term Trend: Ranging
Cardano is also on the ranging movement on the 4-hour chart. The ranging movement continues in the Cardano market as the bulls could not push up the Cardano price above the $0.31 level. Likewise, the bears are unable to push down the price below the $0.29 level and this makes Cardano continue in a ranging movement.

Cardano price is trading over and around the 9-periods EMA and 21-periods EMA while the fast EMA interlocks with the slow EMA. The relative strength index period 14 is at 50 levels and the signal line points down to indicate a sell signal.
You can purchase Lucky Block here. Buy LBLOCK