Bears may continue dominating S&P 500 market
S&P 500 Price Analysis – 21 February
In case selling pressure picks up, the S&P 500 may break through the $3927 support level, and more selling pressure could drive the price down to the $3740 and $3649 levels. The price may revert and increase in the direction of the resistance levels of $4087, $4169, and $4276 if the $3927 support level is retained.
Key levels:
Resistance levels: $4087, $4169, $4276
Support levels: $3927, $3740, $3649
S&P 500 Long-term trend: Bearish
S&P 500 is moving in a bearish direction on the daily chart. It was a nice season for purchasers last two weeks. The price was increasing steadily till it reaches the resistance level of $4169. The bulls’ momentum failed and the mentioned level could not be penetrated. Throughout last week the price was ranging between the $4169 and $4087 levels. On 17 February, sellers forced the price down below $4087 level and the price is heading toward $3827 level.
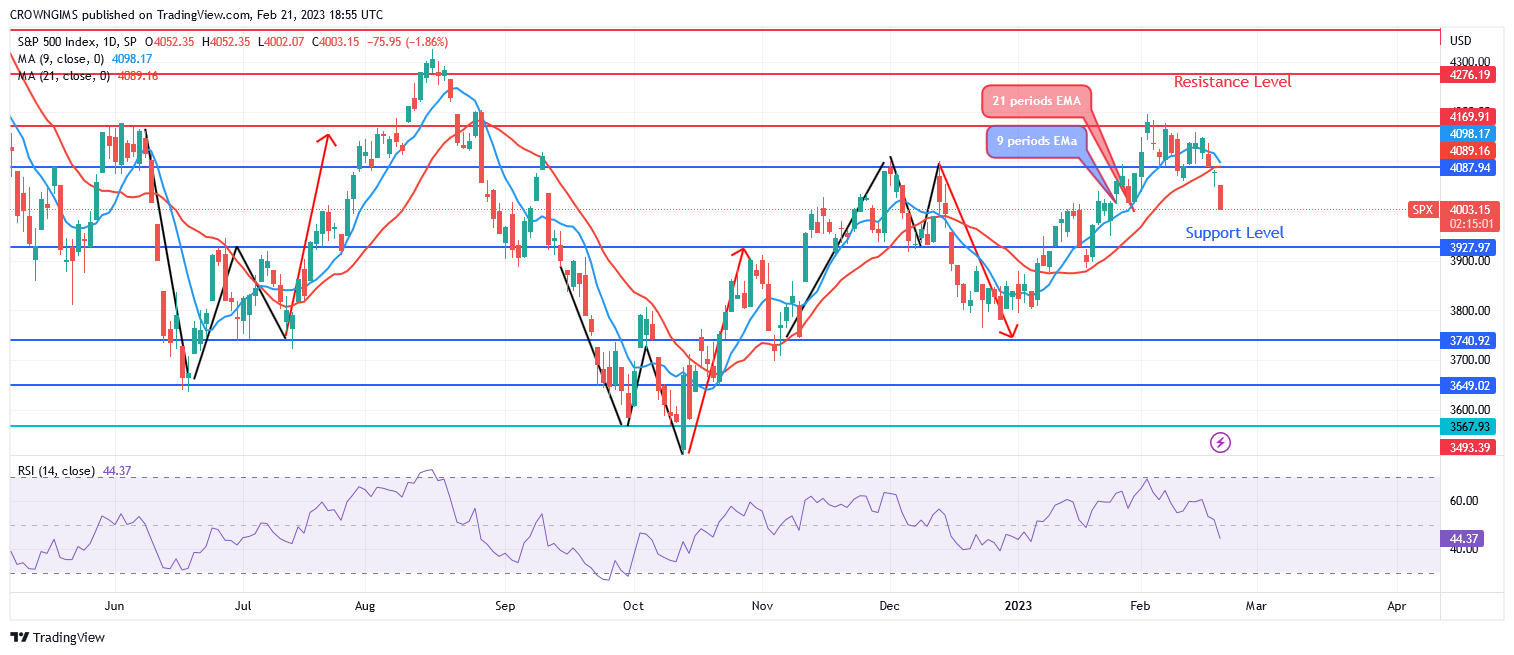
S&P 500 is now trading below the 9-period and 21-period exponential moving averages. In case selling pressure picks up, the S&P 500 may break through the $3927 support level, and more selling pressure could drive the price down to the $3740 and $3649 levels. The price may revert and increase in the direction of the resistance levels of $4087, $4169, and $4276 if the $3927 support level is retained. The relative strength index period 14 is at 43 and the signal line heading downward represents a sell signal.
S&P 500 Medium-term Trend: Bearish
On the 4-hour chart, the S&P 500 is in the bearish direction. The sellers defended the resistance level of $4169 and the S&P 500 could not increase further. The buyers’ power diminished as the price approached the $4169 resistance level. It resumed trading bearishly when the just mentioned level holds. The price may continue a bearish trend this week.
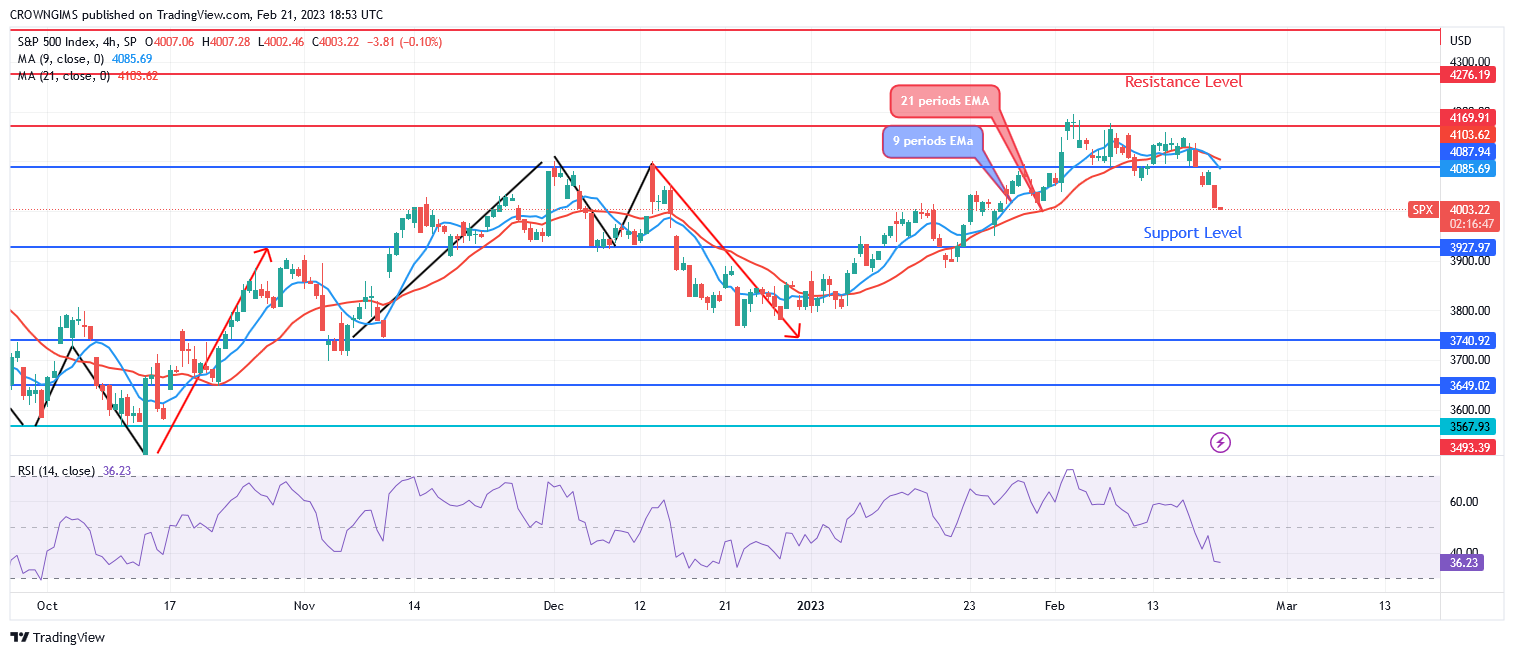
The current price is below $4169. The S&P 500 price is trading below the 9- and 21-period exponential moving averages. The Relative Strength Index period 14 at level 35 displays a bearish signal.
You can purchase Lucky Block – Guide, Tips & Insights | Learn 2 Trade here. Buy LBLOCK
- Broker
- Min Deposit
- Score
- Visit Broker

- Award-winning Cryptocurrency trading platform
- $100 minimum deposit,
- FCA & Cysec regulated

- 20% welcome bonus of upto $10,000
- Minimum deposit $100
- Verify your account before the bonus is credited
- Fund Moneta Markets account with a minimum of $250
- Opt in using the form to claim your 50% deposit bonus
Learn to Trade
Never Miss A Trade Again

Signal Notification
Real-time signal notifications whenever a signal is opened, closes or Updated

Get Alerts
Immediate alerts to your email and mobile phone.

Entry Price Levels
Entry price level for every signal Just choose one of our Top Brokers in the list above to get all this free.