

Quant Price Forecast: February 21
Quant Long-Term Trend: Bullish (1-Day Chart)
Key Levels:
Zones of supply: $155.70, $227.70
Zones of Demand: $101.30, $125.25
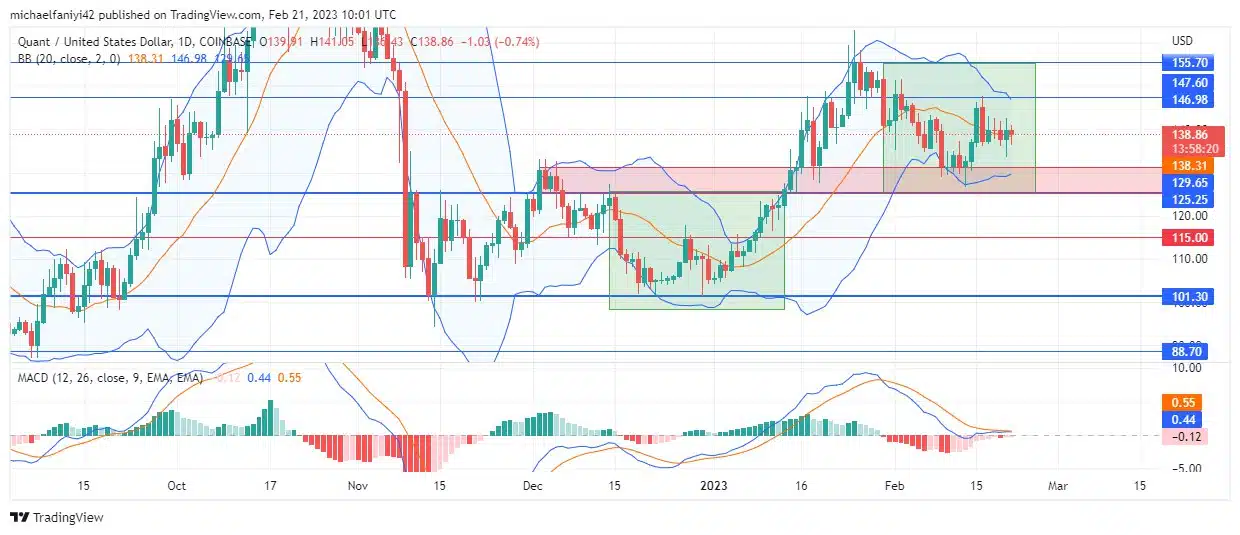
Quant is still on the bullish prowl, and more upside movement is expected from the coin. However, the price trades laterally after being blocked on its way to rising back to $155.70. The lateral movement is an opportunity for buyers to restructure themselves in preparation for a bullish drive. Therefore, after this stage, traders should be alert for a bullish surge that will likely break through toward $227.70.
Quant Price Forecast: QNT/USD Outlook
Quant did not push past the $155.70 resistance level on the first test. It led to the coin stooping lower to reinforce its bullish market.
The price then rose again for a second test of the resistance level. However, the coin has held a lower resistance of $147.60.
Thus, the coin is trading sideways along the mid-line of the Bollinger Bands. The MACD (Moving Average Convergence Divergence) lines are a little above the zero level to show buyer dominance.
QNT/USD Medium-Term Trend: Bullish (4-hour chart)
The 4-hour time frame is almost a replica of the daily time frame. The market is trading between the $147.60 resistance zone and the $125.25 support zone. The Bollinger Bands are enclosed around the candlesticks as they trade laterally.

The MACD lines on the 4-hour chart also have their lines situated just above the zero level. Though bearish, the histogram bars are tapering down and reducing. This shows that the buyers are still active in the market but are allowing the coin to flow laterally for a while before they suddenly influence the coin again to break through past the $147.60 and the $155.70 supply lines.
Note: Learn2.trade is not a financial advisor. Do your research before investing your funds in any financial asset or presented product or event. We are not responsible for your investing results.


