

S&P 500 Price Analysis – August 18
Despite the prior day’s loss the S&P 500 returns ahead of the mid 4400, reaching as high as 4453 during the European session while writing, the index was up 0.06% on the day. Retail sales in July fell 1.1 percent monthly to $617.7 billion, according to figures released by the US Census Bureau earlier in the prior day.
Key Levels
Resistance Levels: 4600, 4550, 4500
Support Levels: 4400, 4360, 4300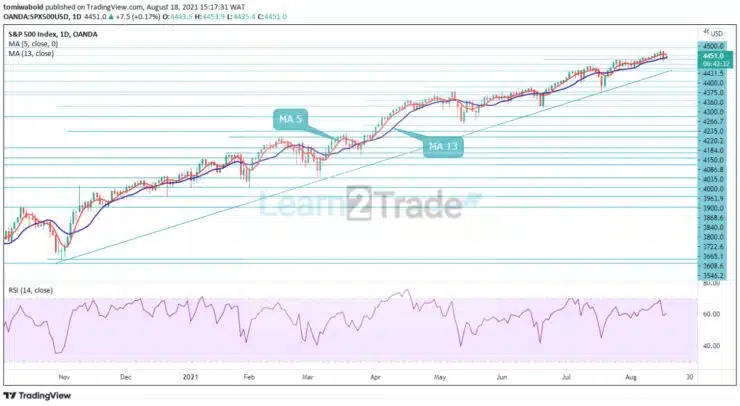
On the daily chart, the index bounced ahead of the horizontal support at 4400. As long as buyers maintain control, a persistent push past the mid-4400 level appears unavoidable. The S&P 500 could reach the medium to long-term price zone of 4500 levels if the above-mentioned point is breached repeatedly.
Support, on the other hand, is visible near the levels of 4431 and 4400 in the present session. Following the initial rise, a rebound towards a prior high near 4478 or higher at 4482 levels could be expected. As a result, a possible long entry is to wait for a pullback to the support area near the 4400 levels.
On the 4-hour time frame, the breach of the 4431 levels is visible, indicating the importance of this level, which is further supported by the fact that the moving average 5 may later attempt to cross the horizontal support line, validating a retracement and its subsequent bounce.
Technically, this level separates the decline from the rally. As a result, many traders avoid buying the asset when it is trading below level 4431, as a move above that level creates a buying signal as well. Overall, in the short term, the S&P 500 continues to consolidate and remain bid at the upside channel.
Note: Learn2.trade is not a financial advisor. Do your research before investing your funds in any financial asset or presented product or event. We are not responsible for your investing results


