

Key Highlights
Solana rebounds as it reaches the $151 high
The crypto is trapped between the moving average lines
Solana (SOL) Current Statistics
The current price: $150.97
Market Capitalization: $87,482,619,216
Trading Volume: $2,199,813,358
Major supply zones: $180, $200, $220
Major demand zones: $100, $80, $60
Solana (SOL) Price Long-Term Prediction: Bullish
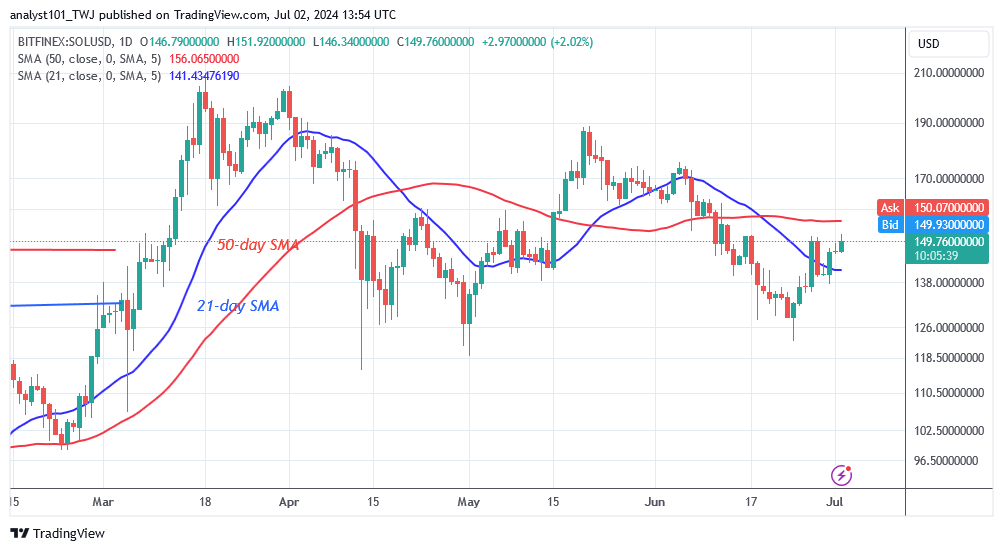
The price of Solana (SOL) increased after surpassing the low of 122.75 but hit the hurdle at $155. The altcoin surged and broke above the 21-day SMA, but the upswing was halted at $151 resistance. The crypto’s price has been trapped between the moving averages after two attempts to break the recent high.
Solana is trading above the 21-day SMA support and below the 50-day SMA resistance. Solana will trend once the existing support and resistance levels are breached. For example, if buyers sustain the price above the 50-day moving average line, the altcoin will surge to a high of $175. In contrast, if the bears break below the 21-day SMA, the altcoin will fall. Solana is now worth $152.
Solana (SOL) Price Indicator Analysis
During the June 27 price bounce, the altcoin rallied above the 21-day SMA and began its upward trend. SOL is anticipated to reach a high of 50 days SMA. When the altcoin breaks above the 50-day SMA, it will restart its bullish trend. SOL will be trapped for a few more days if the moving average lines reject it.
What Is the Next Move for Solana (SOL)?
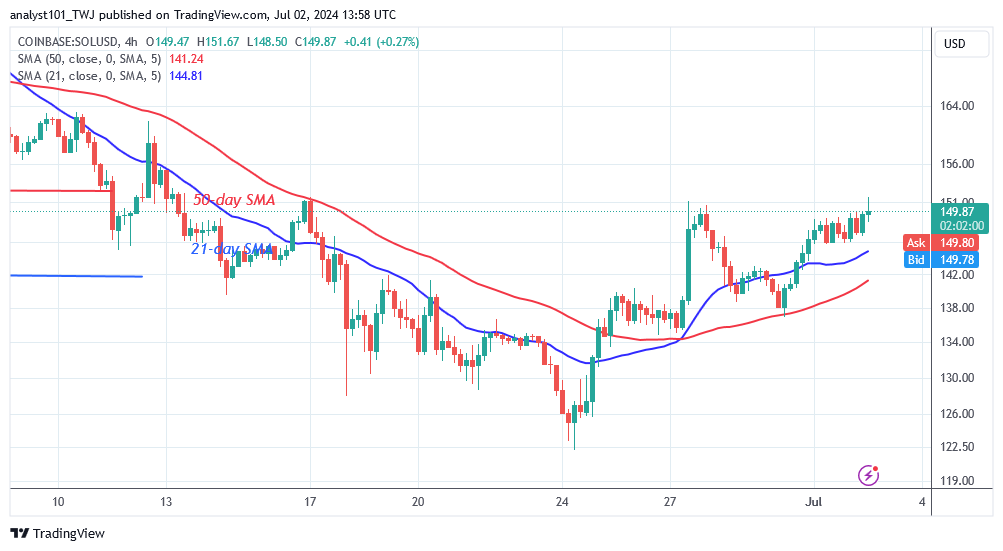
On the 4-hour chart, Solana resumed positive momentum by breaking above the 21-day moving average line and hit the hurdle at $155. The upward trend is meeting an initial resistance at the high of $151. On June 27, the altcoin was repulsed, falling between the moving average lines.
Bulls bought the dips, and the altcoin rose above the 21-day SMA. The crypto signal since it is stuck between the moving average lines.
You can purchase Lucky Block here. Buy LBLOCK
Note: Learn2.Trade is not a financial advisor. Do your research before investing your funds in any financial asset or presented product or event. We are not responsible for your investing.


