Silver market is becoming more active for sellers
SILVER Price Analysis – 22 June
In case demand increases once the $22 level is broken higher, Silver resistance levels of $23 and $24 can be put to the test. Silver’s price may fall and test the $20 and $19 support levels if sellers are able to hold the $22 price level and the $21 support level is broken.
XAGUSD Market
Key Levels:
Resistance levels: $22, $23, $24
Support levels: $21, $20, $19
XAGUSD Long-term trend: Bearish
The long-term forecast for silver is negative. The start of a downward trend is mostly attributable to the double-top chart pattern that first occurred at $25. Above that level, the price of white metal rose from $19 to $23 levels. Since May 5, more bearish candles have appeared, and sellers have dominated the silver market. The purchasers are trying to cut their losses as the price drops toward the low support level of $23. In a market that is trending, price retracements are unavoidable; last two weeks, it occurred tested the $24 resistance level once more. At the moment, sellers are dominating the market and the price exposes to $21 level.
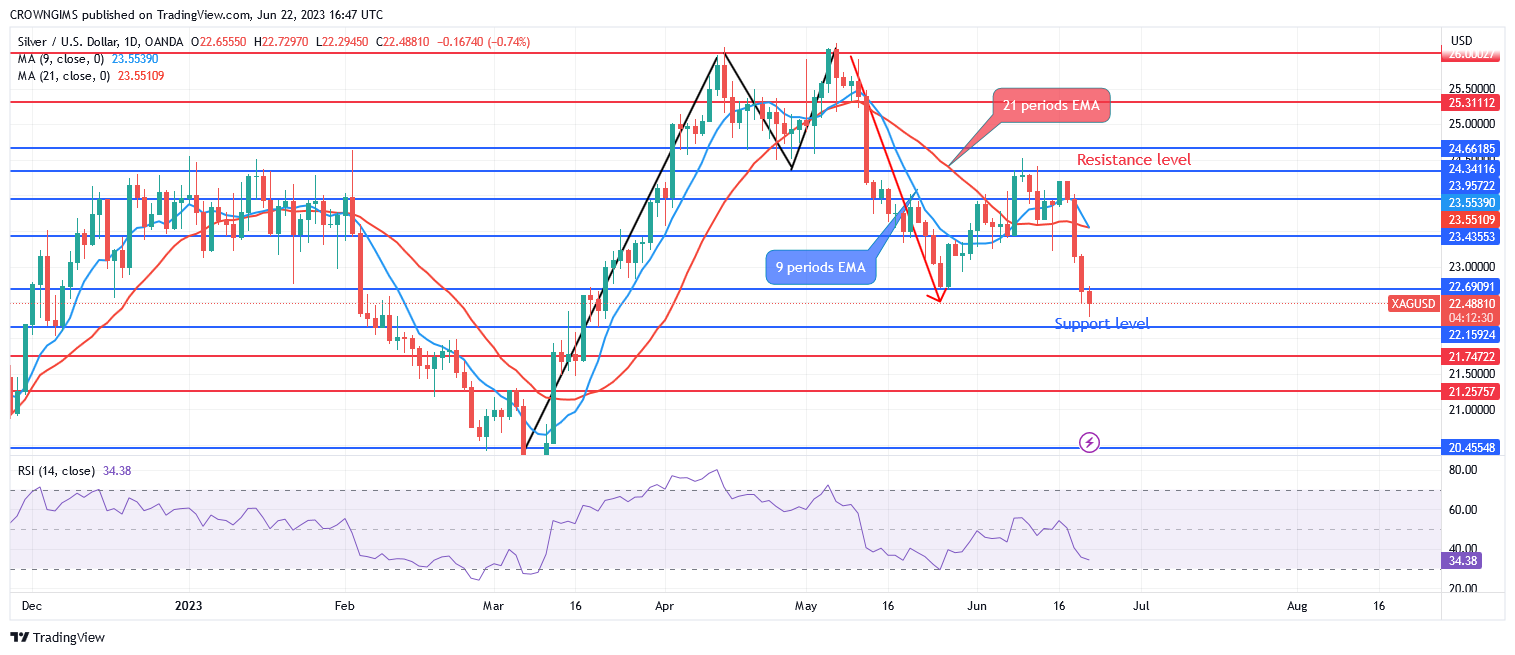
The white metal is trading in a negative trend below the 9-period and 21-period exponential moving averages while the fast EMA is crossing the slow EMA downward. A selling situation is indicated by the relative strength index period 14 signal lines heading downward at 24. In case demand increases once the $22 level is broken higher, the price resistance levels of $23 and $24 can be put to the test. Silver’s price may fall and test the $20 and $19 support levels if sellers are able to hold the $22 price level and the $21 support level is broken.
XAGUSD Medium-term Trend: Bearish
A bearish phase is present for XAGUSD on the 4-hour chart. The double-top bearish reversal chart pattern is created at the $26 resistance level. After twice reaching a high of $26, the price of white metal began to fall sharply. The prior support levels of $24 and $23 turned became levels of resistance as sellers acquired more traction. The price is declining further.
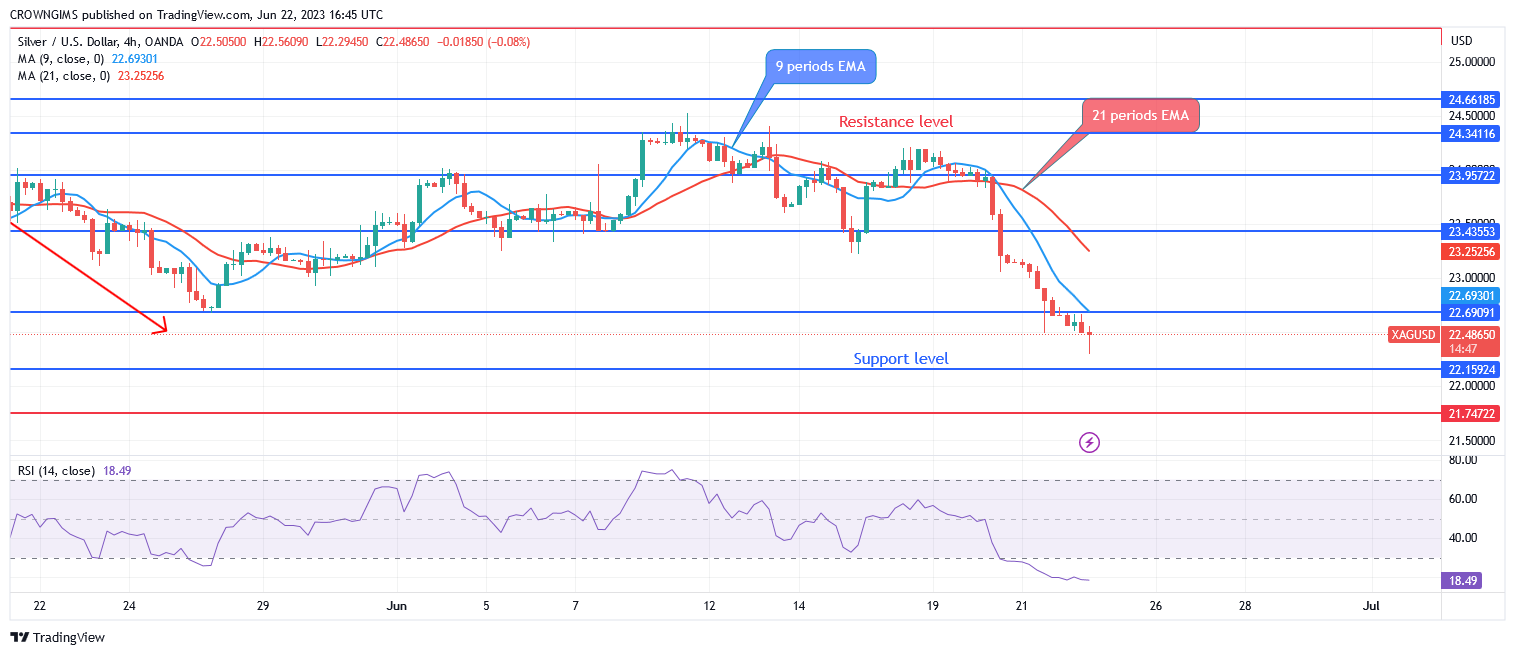
Since silver’s price is currently trading below key dynamic support levels, a bearish market is in place. At a level of 18, the relative strength index period 14 signal line is pointing downward, indicating a sell.
You can purchase Lucky Block – Guide, Tips & Insights | Learn 2 Trade here. Buy LBLOCK
- Broker
- Min Deposit
- Score
- Visit Broker

- Award-winning Cryptocurrency trading platform
- $100 minimum deposit,
- FCA & Cysec regulated

- 20% welcome bonus of upto $10,000
- Minimum deposit $100
- Verify your account before the bonus is credited
- Fund Moneta Markets account with a minimum of $250
- Opt in using the form to claim your 50% deposit bonus
Learn to Trade
Never Miss A Trade Again

Signal Notification
Real-time signal notifications whenever a signal is opened, closes or Updated

Get Alerts
Immediate alerts to your email and mobile phone.

Entry Price Levels
Entry price level for every signal Just choose one of our Top Brokers in the list above to get all this free.