

Buyers’ pressure double
SILVER Price Analysis – 06 March
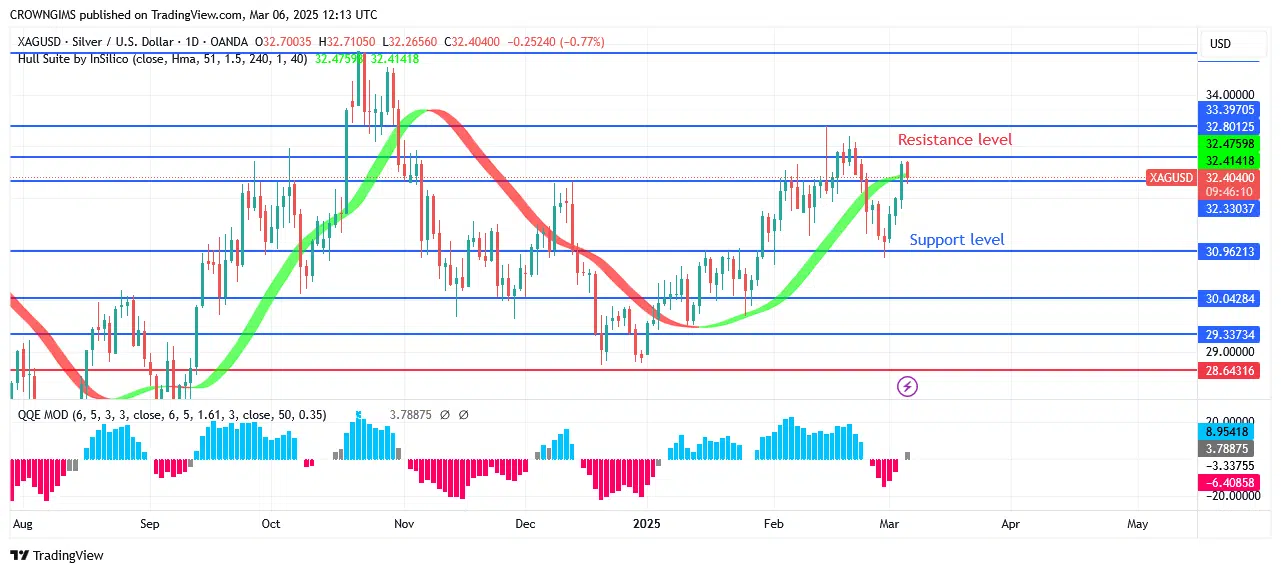
It will try to climb up into the $33–$34 range if the price is higher than $32 and many people are buying it. If sellers are able to hold the $32 price level and the $31 support level is broken, the price of silver may decline and test the $30 and $29 support levels.
XAGUSD Market
Key Levels:
Resistance levels: $32, $33, $34
Support levels: $31, $30, $29
XAGUSD Long-term trend: Bullish
The outlook on the daily silver chart is bullish. The silver market appeared to be controlled by purchasers for a few weeks. Due to higher buyer demand, prices peaked at $32 over the previous month. The white metal began to decline below its previous high of $31 at that time when purchasing persisted on the level and bears stepped in to stop them. There has been bearish activity all day since it seems that the bears have a lot of momentum. A double bottom chart pattern appeared at $28 level and the market began to incline to the $32 barrier.
XAGUSD Medium-term Trend: Bullish
The 4-hour chart of the XAGUSD indicates an upward trend. A double bottom chart pattern emerged close to the $28 barrier, indicating a substantial shift in direction. The $29 threshold is Silver’s first challenge. Exceeding the pre-established price cutoff was prohibited. Due of the significant buying power of the clientele, costs are currently around $32 per unit.

Start using a world-class auto trading solution
You can purchase Lucky Block here. Buy LBLOCK


