

Silver price increases tested the $23 level
SILVER Price Analysis – 08 December
The ability to break up the $22 price level by the bulls may increase the price further to the $23 and $24 levels. Silver price may decrease when the Bulls’ momentum becomes weak and the price could not break up the $22 resistance level, the price may find its support at $21, $20, and $19 levels.
XAGUSD Market
Key Levels:
Resistance levels: $22, $23, $24
Support levels: $21, $20, $19
XAGUSD Long-term trend: Bullish
XAGUSD (Silver) is bullish on the long-term outlook. The white metal is still obeying the command of the double bottom chart pattern formed three weeks ago. Silver tested the support level of $18 two times. The white metal started to be under the control of the bulls on 20 October. The price bounced up from the support level of $18. It increases and breaks up the resistance level of $21 and currently increasing with the target of breaking up the $22 level.
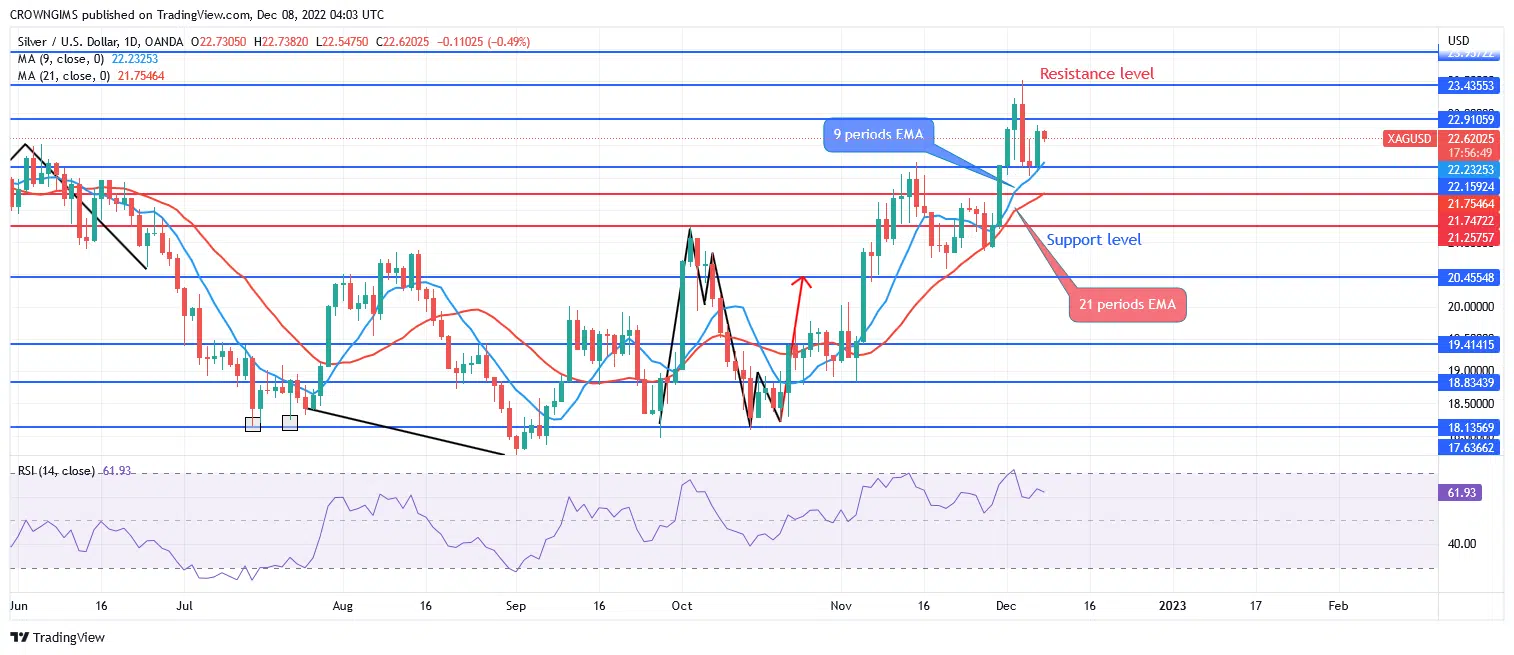
There is an increase in bullish momentum as the Silver price remains above the 9-periods EMA and the 21-period EMA. The relative strength index period 14 is at 61 levels with the signal lines pointing downside to connote sell signaling. The ability to break up the $22 price level by the bulls may increase the price further to the $23 and $24 levels. Silver price may decrease when the Bulls’ momentum becomes weak and the price could not break up the $22 resistance level, the price may find its support at $21, $20 and $19 levels.
XAGUSD Medium-term Trend: Bullish
XAGUSD is bullish on the daily chart. Last three weeks, the price commenced a bullish trend due to the formation of a double-bottom chart pattern at the support level of $18. This is a bullish reversal chart pattern. Silver price bounced up the support level of $18 and increased tested the resistance level of $23.

The Silver price is trading above the 9-periods EMA and 21-periods EMA. The relative strength index period 14 is at 55 levels with the signal lines pointing up to indicate a buy signal.
You can purchase Lucky Block here. Buy LBLOCK


