Buyers’ momentum may increase
AUDUSD Price Analysis – 08 December
In case buyers gain more momentum, the resistance level of $0.68 may not hold and the price may increase to the resistance level of $0.70, and $0.71. When sellers oppose buyers at the $0.68 level, AUDUSD may decrease to the support levels at $0.66, $0.65, and $0.63.
AUD/USD Market
Key levels:
Resistance levels: $0.68, $0.70, $0.72
Support levels: $0.66, $0.65, $0.63
AUDUSD Long-term trend: Bullish
AUDUSD is bullish on the daily chart. The currency pair followed last week’s predictions when the bullish chart pattern formed at the support level of $0.63 level. The resistance levels of $0.65 and $0.66 were broken upside with the strong pressure from the bulls and the price reached the resistance level of $0.68. The price pulled back and retested the support level of $0.66. At the moment AUDUSD is trading within the $0.68 and $0.66 levels.
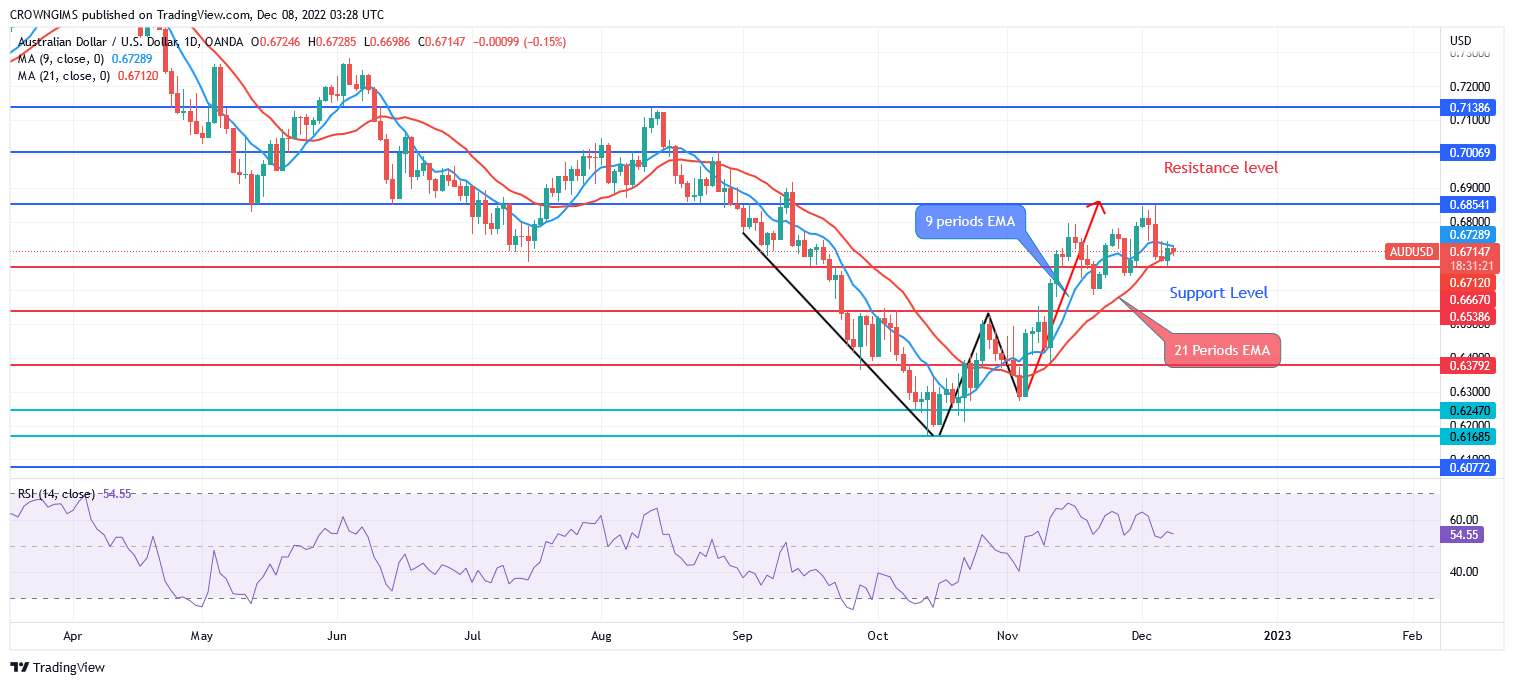
AUDUSD is trading above the 9-periods EMA and 21-periods EMA which indicates that buyers’ momentum is increasing. The relative strength index period 14 is at 54 levels and the signal lines display no specific direction. In case buyers gain more momentum, the resistance level of $0.68 may not hold and the price may increase to the resistance level of $0.70, and $0.71. When sellers oppose buyers at the $0.68 level, the price may decrease to the support levels at $0.66, $0.65, and $0.63.
AUDUSD medium-term Trend: Bullish
AUDUSD is bullish on the 4-hour chart. After the formation of a “W” chart pattern at the support level of $0.63, the bullish trend continues in the 4-hour chart. The bull’s momentum pushed the price to test the resistance level of $0.68 as predicted. After that, the price is dangling within the $0.68 and $0.66 levels.
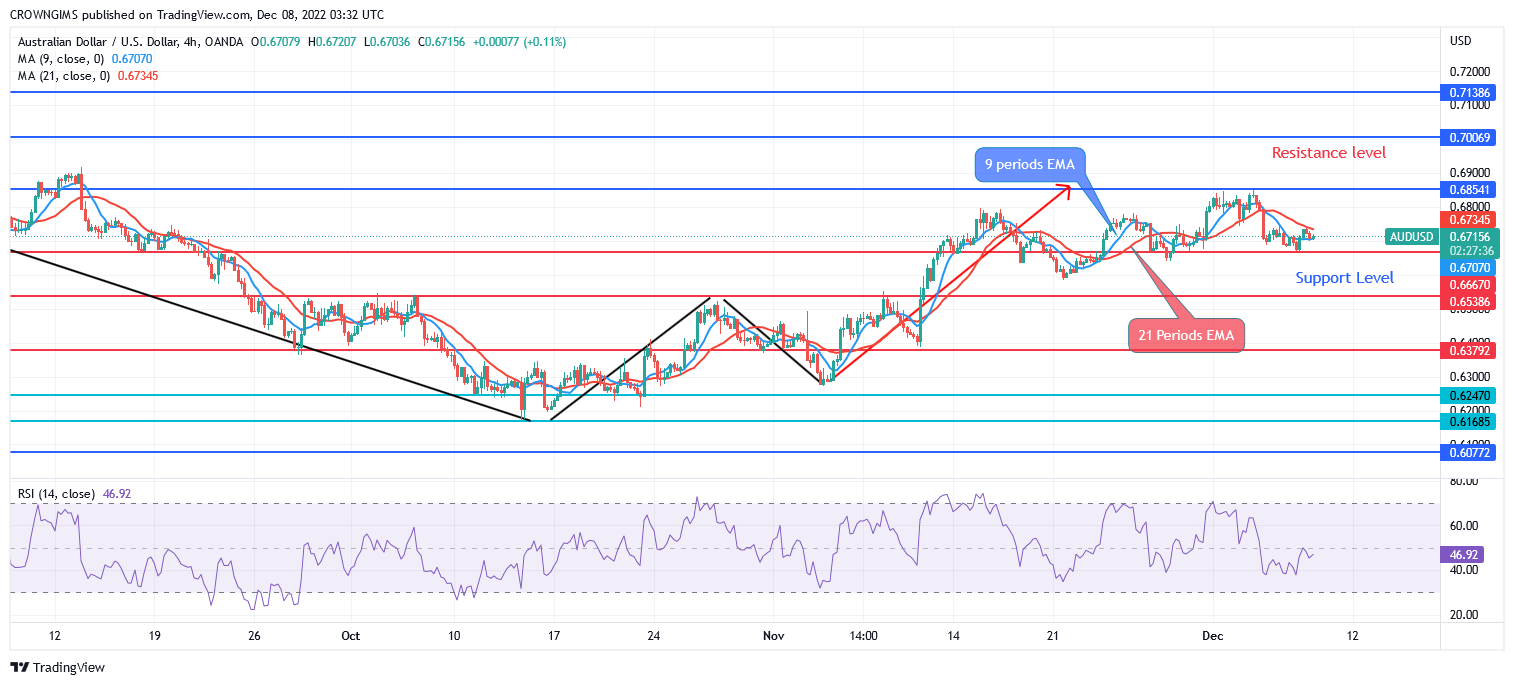
AUDUSD is currently trading around the 9-periods EMA and 21-periods EMA, which indicate a low bullish and bearish momentum. The relative strength index period 14 is at 48 levels with the signal lines pointing up to indicate a buy signal.
You can purchase Lucky Block – Guide, Tips & Insights | Learn 2 Trade here. Buy LBLOCK
- Broker
- Min Deposit
- Score
- Visit Broker

- Award-winning Cryptocurrency trading platform
- $100 minimum deposit,
- FCA & Cysec regulated

- 20% welcome bonus of upto $10,000
- Minimum deposit $100
- Verify your account before the bonus is credited
- Fund Moneta Markets account with a minimum of $250
- Opt in using the form to claim your 50% deposit bonus
Learn to Trade
Never Miss A Trade Again

Signal Notification
Real-time signal notifications whenever a signal is opened, closes or Updated

Get Alerts
Immediate alerts to your email and mobile phone.

Entry Price Levels
Entry price level for every signal Just choose one of our Top Brokers in the list above to get all this free.