

Bullish momentum may increase further in SHIB market
Shiba Inu (SHIB) Price Analysis: 02 July
Shiba Inu may rise above the $0.0000083 resistance level and test the $0.0000091 and $0.000010 levels if buyers keep up their pressure. The price of the cryptocurrency may go below $0.0000073 and reach the support levels of $0.0000059 and $0.0000050 if bears are successful in holding the $0.0000083 level.
Key Levels:
Resistance Levels: $0.0000083, $0.0000091, $0.000010
Support Levels: $0.0000073, $0.0000059, $0.0000050
SHBUSD Long-term Trend: Bullish
Shiba Inu’s daily chart shows a bullish trend. Four weeks ago, the coin’s value changed, bouncing between $0.0000091 and $0.0000083. On June 5, sellers exerted pressure and drove the price down to the $0.0000073 level and below the $0.0000083 support level. After reaching the support level of $0.0000059 last week, the price fell. The market is being controlled by buyers, and the previous resistance level of $0.0000073 has changed to a support level. Testing was done at the $0.0000083 resistance level and pulled back.
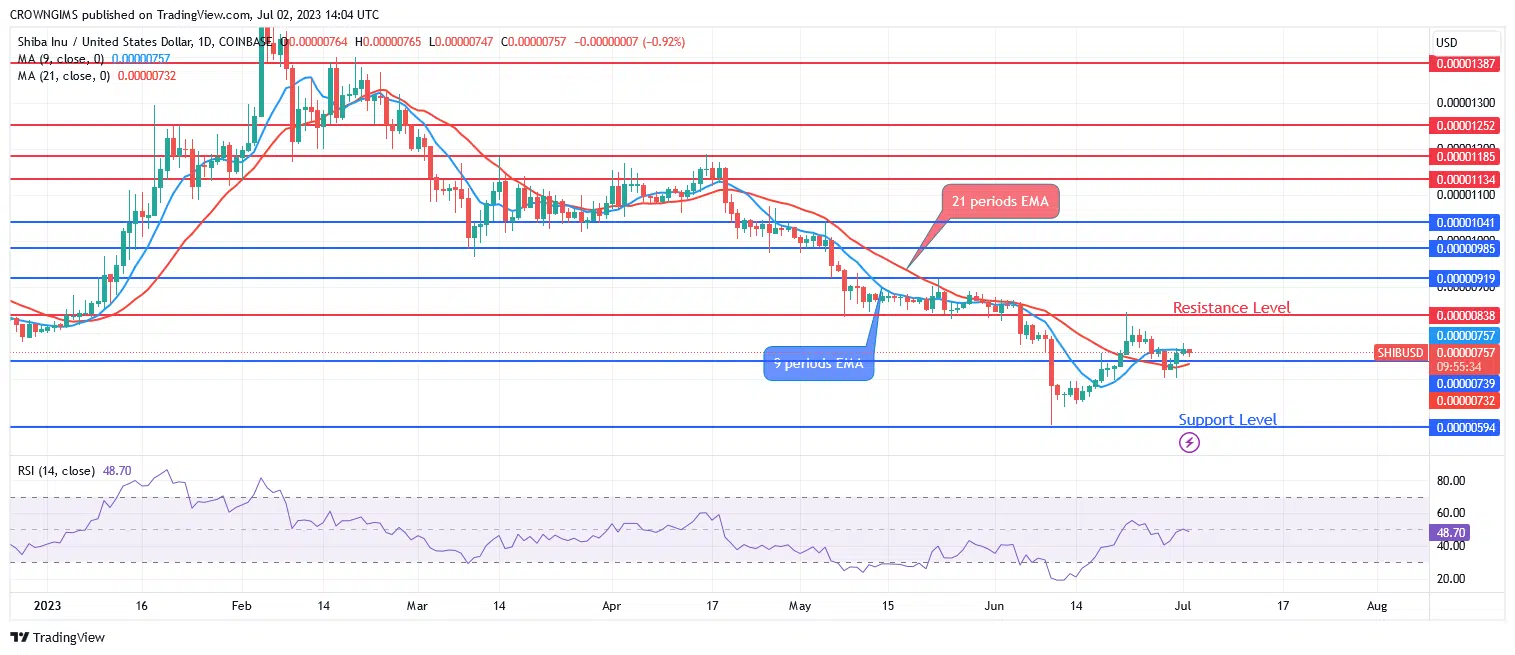
After the 9-period EMA passed above the 21-period EMA, the price is now moving above the two EMAs. Shiba Inu may rise above the $0.0000083 resistance level and test the $0.0000091 and $0.000010 levels if buyers keep up their pressure. The price of the cryptocurrency may go below $0.0000073 and reach the support levels of $0.0000059 and $0.0000050 if bears are successful in holding the $0.0000083 level. The relative index period 14 indicating up at level 48 serves as a purchase signal.
SHIBUSD Price Medium-term Trend: Bullish
On the 4-hour chart, Shiba Inu is bullish. When the cryptocurrency’s value dropped below $0.0000091 during the previous four weeks, selling outpaced buying. The eagerness of the sellers drove the price lower at the aforementioned level, breaching the $0.0000083 support level and testing $0.0000059 in the process. As the resistance level of $0.0000083 is challenged, the price seems to be fluctuating between $0.0000073 and $0.0000083.

Shiba Inu is currently trading around the 9-period and 21-period exponential moving averages, which is a ranging indicator. The Relative Strength Index’s 50 levels show a bearish trend.
You can purchase Lucky Block here. Buy LBLOCK


