Bears’ pressure is reducing
Shiba Inu (SHIB) Price Analysis: 13 April
The price may be able to overcome the resistance levels of $0.000015 and $0.000016, respectively, if buyers can push the price over the $0.000013 level. The price may fall below $0.000012 and attempt to test the support levels of $0.000011 and $0.000010, respectively, if sellers are successful in holding the currency.
Key Levels:
Resistance Levels: $0.000013, $0.000015, $0.000016
Support Levels: $0.000012, $0.000011, $0.000010
SHIBUSD
Long-term Trend: Bearish
The Shiba Inu daily chart has a clear bearish reversal indicator. Since December 8, sellers have controlled the SHIB market. The price crossed the threshold at $0.000020. Often, bearish candlestick patterns showed that the market was dominated by sellers. The bears’ fervor caused the price to drop below $0.000013. The buyer’s selection was incorporated into the transaction following a review at the assigned support level. At the moment, the market is showing a significant downward trend close to the $0.000012 support level. When prices drop below the previously indicated level, sellers take over.
 .000011 Zone" width="1281" height="573" data-lazy-src="https://learn2.trade/wp-content/uploads/2025/04/Daily-37.png"/>
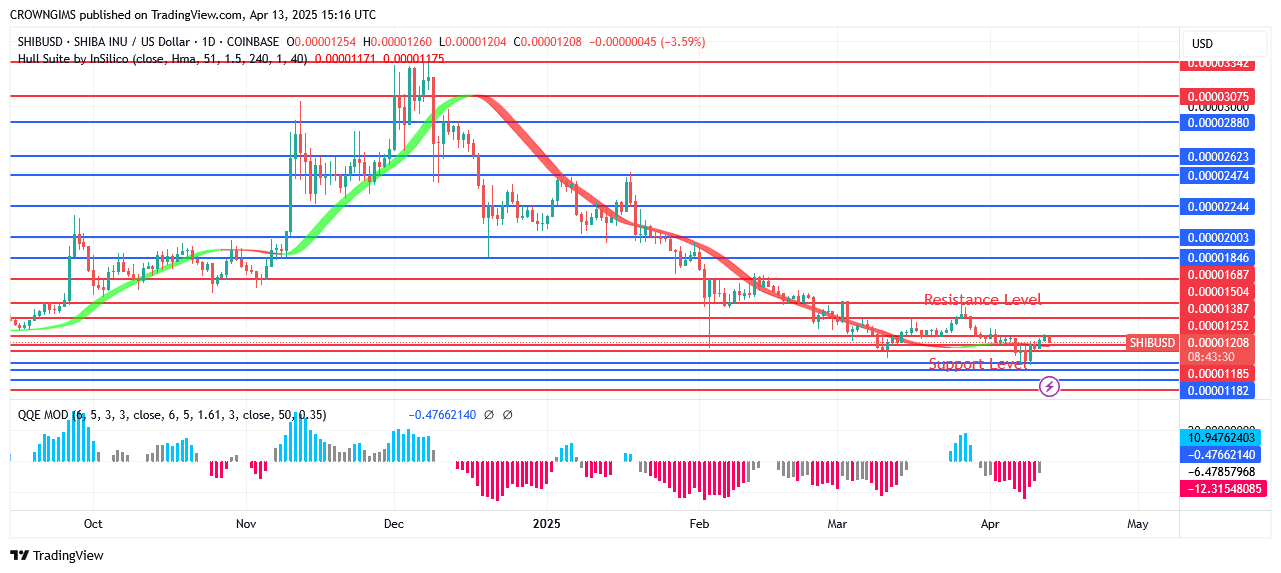
The Hull Suite Crypto signals indicator is satisfied by the current SHIB cost. The price may be able to overcome the resistance levels of $0.000015 and $0.000016, respectively, if buyers can push the price over the $0.000013 level. The price may fall below $0.000012 and attempt to test the support levels of $0.000011 and $0.000010, respectively, if sellers are successful in holding the currency.
SHIBUSD Price Medium-term Trend: Bullish
The Shiba Inu price incline during a four-hour period is displayed in the pricing table. The coin has been bought and traded for more than $0.000012 in the last two days. Despite the price cut, customers still visit the stores. The price dropped, tested the $0.000012 mark, and then bounces up at 0.000011. If the 4-hour candle closes below $0.000011, the price could fall sharply.
.000011 Zone" width="1281" height="573" data-lazy-src="https://learn2.trade/wp-content/uploads/2025/04/4-hours-36.png"/>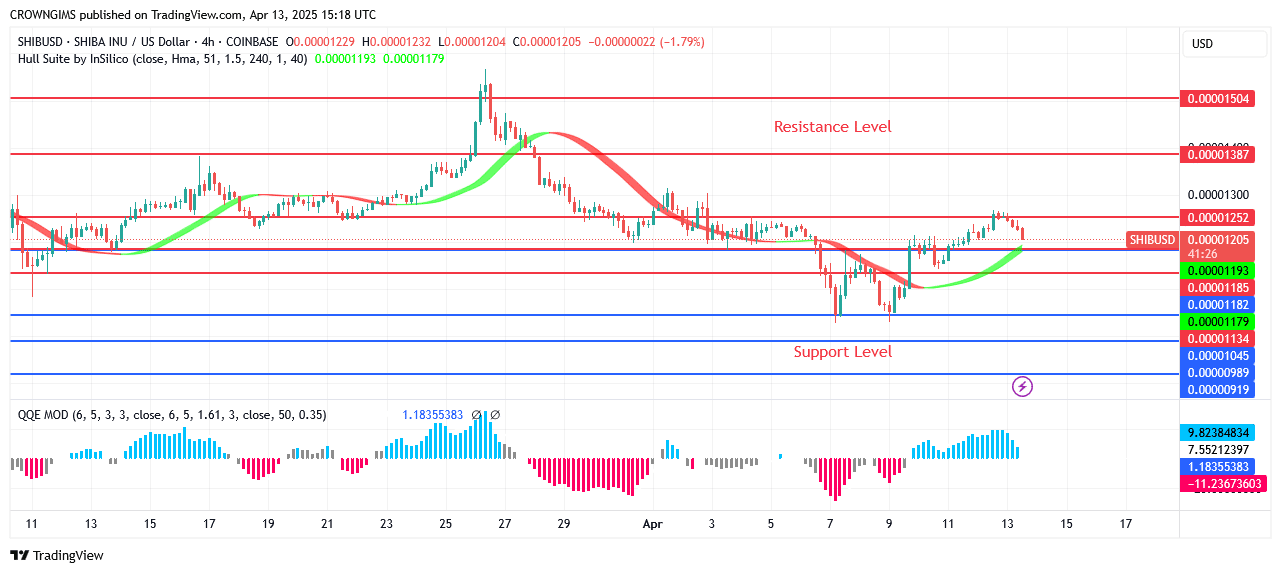
Start using a world-class auto trading solution
You can purchase Lucky Block – Guide, Tips & Insights | Learn 2 Trade here. Buy LBLOCK
- Broker
- Min Deposit
- Score
- Visit Broker

- Award-winning Cryptocurrency trading platform
- $100 minimum deposit,
- FCA & Cysec regulated

- 20% welcome bonus of upto $10,000
- Minimum deposit $100
- Verify your account before the bonus is credited
- Fund Moneta Markets account with a minimum of $250
- Opt in using the form to claim your 50% deposit bonus
Learn to Trade
Never Miss A Trade Again

Signal Notification
Real-time signal notifications whenever a signal is opened, closes or Updated

Get Alerts
Immediate alerts to your email and mobile phone.

Entry Price Levels
Entry price level for every signal Just choose one of our Top Brokers in the list above to get all this free.