Key Resistance Zones: 3300, 3400, 3500
Key Support Zones: 2800, 2700, 2600
Shanghai SE Composite Index (SHCOMP) Long-term Trend: Ranging
The index is consolidating between levels 3200 and 3400. The price fluctuation is concentrated at the upper range. In the last three months, the price sideways move has persisted. The index is yet to trend since July.
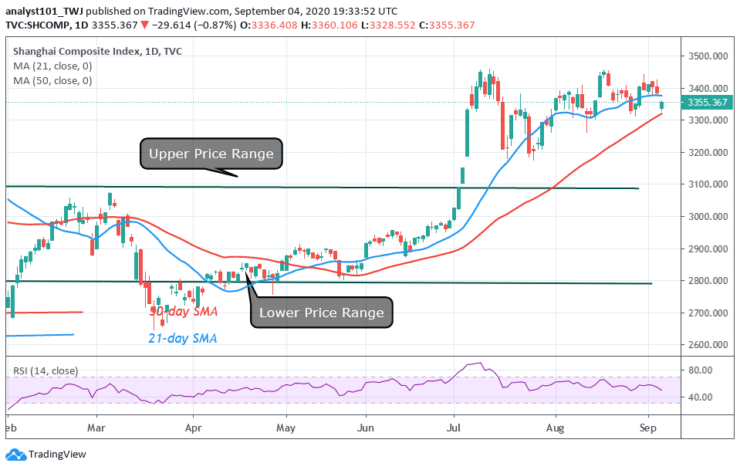
Daily Chart Indicators Reading:
SHCOMP is at level 50 of the Relative Strength Index. There is balance between supply and demand. The 21-day SMA and 50-day SMA are sloping sideways indicating the sideways trend.
Shanghai SE Composite Index (SHCOMP) Medium-term Trend: Ranging
On the 4- hour chart, the index is a sideways move. The price is also fluctuating between levels 3200 and 3400. The price has continued to be in a sideways move. However, the market has continued its sideways move within the price range. The price action is similar to the one on the daily chart.
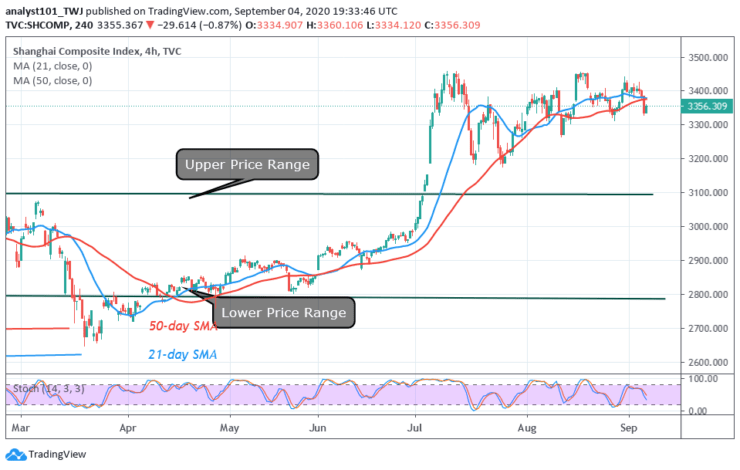
4-hour Chart Indicators Reading
SHCOMP is below 50 % range of the daily stochastic. It indicates that the market is in a bearish momentum. The 21-day SMA and the 50-day SMA are sloping sideways indicating the sideways trend.
General Outlook for Shanghai SE Composite Index (SHCOMP)
SHCOMP is still trading between levels 3200 and 3400. Since July the price has continued to consolidate within the price range. The index is in a choppy price action
Note: Learn2.Trade is not a financial advisor. Do your research before investing your funds in any financial asset or presented product or event. We are not responsible for your investing results
- Broker
- Min Deposit
- Score
- Visit Broker

- Award-winning Cryptocurrency trading platform
- $100 minimum deposit,
- FCA & Cysec regulated

- 20% welcome bonus of upto $10,000
- Minimum deposit $100
- Verify your account before the bonus is credited
- Fund Moneta Markets account with a minimum of $250
- Opt in using the form to claim your 50% deposit bonus
Learn to Trade
Never Miss A Trade Again

Signal Notification
Real-time signal notifications whenever a signal is opened, closes or Updated

Get Alerts
Immediate alerts to your email and mobile phone.

Entry Price Levels
Entry price level for every signal Just choose one of our Top Brokers in the list above to get all this free.