Key Support Levels: $0.25, $0.20, $0.15
XRP/USD Long-term Trend: Bearish
Ripple is trading at the bottom of the chart between $0.12 and $0.17.
The coin was trading above $0.20 support before the breakdown. The market fell from a high of $0.20 to a low of $0.12. The bulls pulled back to a high of $0.17 but were resisted. In the meantime, XRP is trading at $0.14. On the downside, if the bears break the $0.12 support, Ripple may fall to the low of $0.10. However, on the upside, if the price breaks the $0.17 resistance, XRP will rally above $0.20. Presently, Ripple is still fluctuating between $0.12 and $0.17,
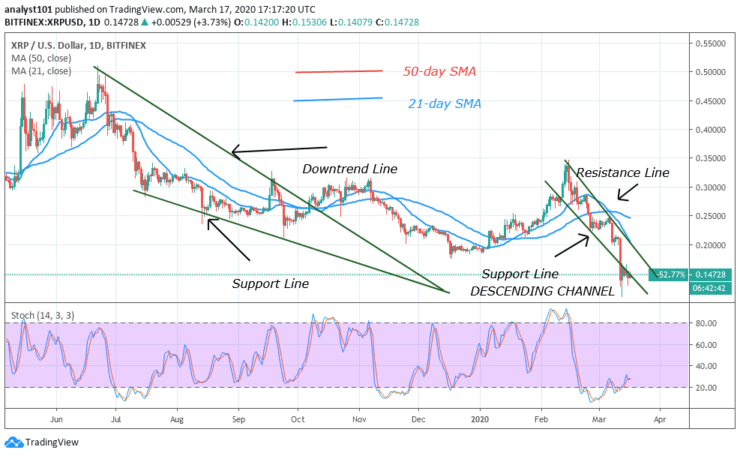
Daily Chart Indicators Reading:
Ripple is trading above 20% range of the daily stochastic. It indicates that Ripple is in bullish momentum. Ripple is out of the oversold region and the bulls are expected to emerge to push XRP upward.
XRP/USD Medium-term Trend: Bearish
On the 4-hour chart, Ripple has fallen to the low of $0.12 and the coin trades between $0.12 and $0.17. The bulls have made three attempts at $017 resistance but were resisted. The upward move has been hampered because of the resistance at $0.17.
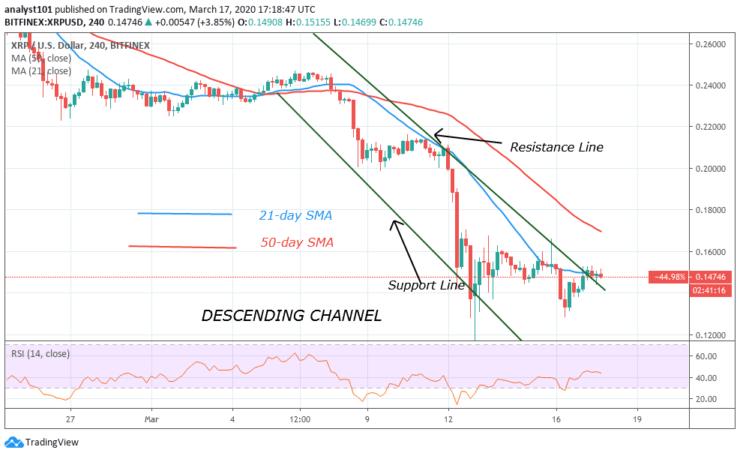
4-hour Chart Indicators Reading
Ripple is rising as it reaches level 45 of the Relative Strength index. Ripple is below the centerline 50 indicating that it is in the downtrend zone. It is also likely to fall. Nevertheless, the 21-day and 50-day SMAs are sloping southward indicating the downtrend.
General Outlook for Ripple (XRP)
Ripple is at the bottom of the chart but it is trading at $0.149 as at the time of writing. The coin is still fluctuating within the confined range as the bulls and bears are undecided about the direction of the market. The downtrend will resume as soon as the lower price range is broken. A break above the upper price will mean the resumption of an uptrend.
Ripple (XRP) Trade Signal
Instrument: XRPUSD
Order: Sell
Entry price: $0.149
Stop: $0.160
Target: $0.127
Note: Learn2Trade.com is not a financial advisor. Do your research before investing your funds in any financial asset or presented product or event. We are not responsible for your investing results
- Broker
- Min Deposit
- Score
- Visit Broker

- Award-winning Cryptocurrency trading platform
- $100 minimum deposit,
- FCA & Cysec regulated

- 20% welcome bonus of upto $10,000
- Minimum deposit $100
- Verify your account before the bonus is credited
- Fund Moneta Markets account with a minimum of $250
- Opt in using the form to claim your 50% deposit bonus
Learn to Trade
Never Miss A Trade Again

Signal Notification
Real-time signal notifications whenever a signal is opened, closes or Updated

Get Alerts
Immediate alerts to your email and mobile phone.

Entry Price Levels
Entry price level for every signal Just choose one of our Top Brokers in the list above to get all this free.