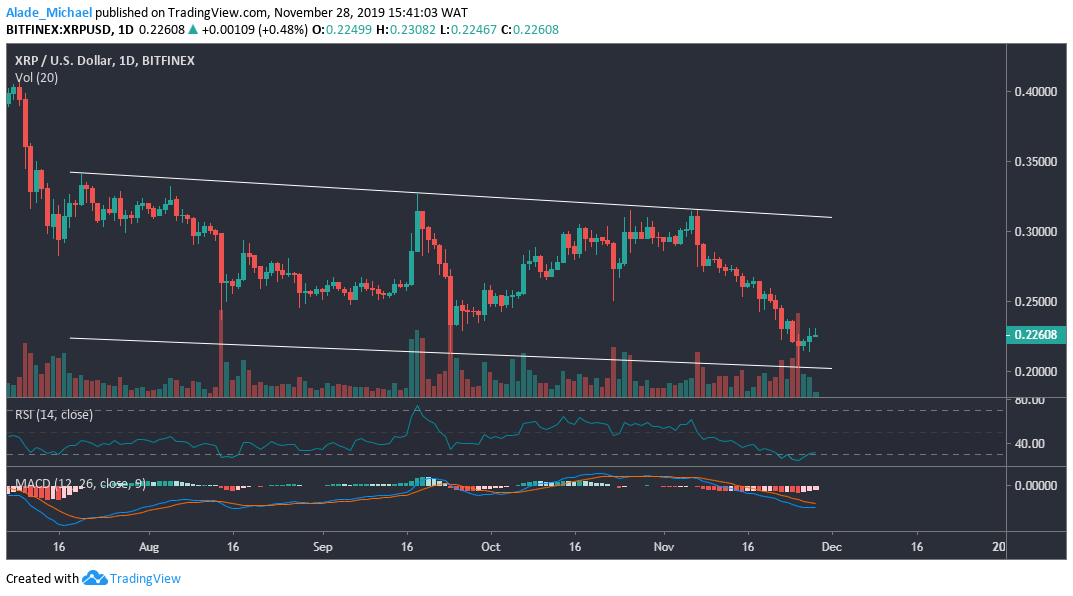
Ripple (XRP) is slowly recovering from a six-month low of $0.20 over the last three days of trading. Currently, the market is correcting gain of about +2.63. Though the long-term bearish bias remains dominant as there’s hope for reversal if the bulls can reclaim the $0.30 resistance. Nonetheless, the weak buying pressure is still keeping the bullish momentum slow.
Ripple (XRP) Price Analysis: Daily Chart – Bearish
Key resistance levels: $0.25, $0.30
Key support levels: $0.20, $0.18
In late October, we saw how Ripple (XRP) bounced off the channel’s lower boundary all the way to the channel’s upper boundary this month. As we can see now, the same scenario is currently playing out in the market following the November 25 recovery at $0.20 support. XRP is now bouncing back towards $0.25 resistance. The bulls may reclaim $0.30 resistance if the primary resistance breaks.

Looking at the market, we can see that XRP is climbing back on the RSI indicator but the bullish formation is still unclear. There’s a need for a significant rise above the RSI oversold level. Conversely, the MACD shows that the bearish action is still dominant. In case of a bearish regroup, the market is likely to roll back to the base of the channel at $0.2. A slight break could send XRP price to $0.18.
Ripple (XRP) Price Analysis: Hourly Chart – Bullish
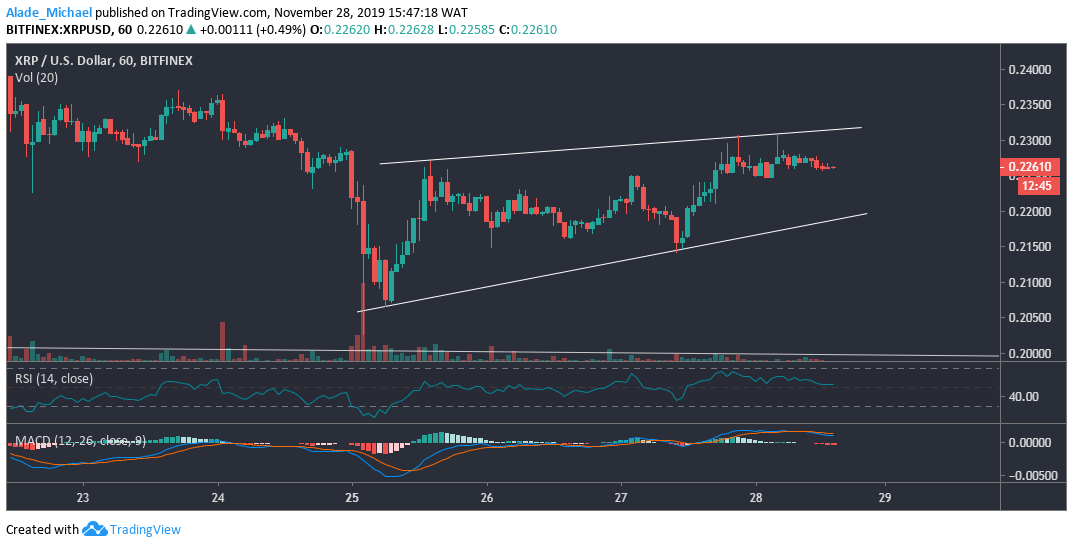
The hourly chart for Ripple’s XRP suggests an upward movement which is currently shaping inside a rising wedge pattern. Early today, XRP touched the upper boundary of the wedge but it now appeared that a price drops could be underway. There’s near support at $0.22 on the wedge’s lower boundary before resuming bullish. Below the wedge, support is located at $0.207.

On the upside, XRP is currently holding resistance $0.231, where the channel’s resistance lies. A further price gain could bring the XRP market out of the wedge to $0.24 and $0.25resistance. At the moment, RSI is currently sitting on the 50 levels. An intense buying pressure would occur if the RSI level can bolster as support. As suggested on the hourly MACD, the XRP bulls are gaining control of the market we can expect a more positive climb in future trading.
XRP BUY SIGNAL
Buy Entry: $0.22
TP: $0.24
SL: $0.21
- Broker
- Min Deposit
- Score
- Visit Broker
- Award-winning Cryptocurrency trading platform
- $100 minimum deposit,
- FCA & Cysec regulated
- 20% welcome bonus of upto $10,000
- Minimum deposit $100
- Verify your account before the bonus is credited
- Fund Moneta Markets account with a minimum of $250
- Opt in using the form to claim your 50% deposit bonus
Learn to Trade
Never Miss A Trade Again

Signal Notification
Real-time signal notifications whenever a signal is opened, closes or Updated

Get Alerts
Immediate alerts to your email and mobile phone.

Entry Price Levels
Entry price level for every signal Just choose one of our Top Brokers in the list above to get all this free.


