Don’t invest unless you’re prepared to lose all the money you invest. This is a high-risk investment and you are unlikely to be protected if something goes wrong. Take 2 minutes to learn more
Quant Price Forecast – August 19th
The Quant Price Forecast indicates that bears continue to push prices lower with strong momentum.
QNTUSD Long Term Trend: Bearish (1-Day Chart)
Key Levels
Support Levels: $91.00, $80.00
Resistance Levels: $69.10, $58.00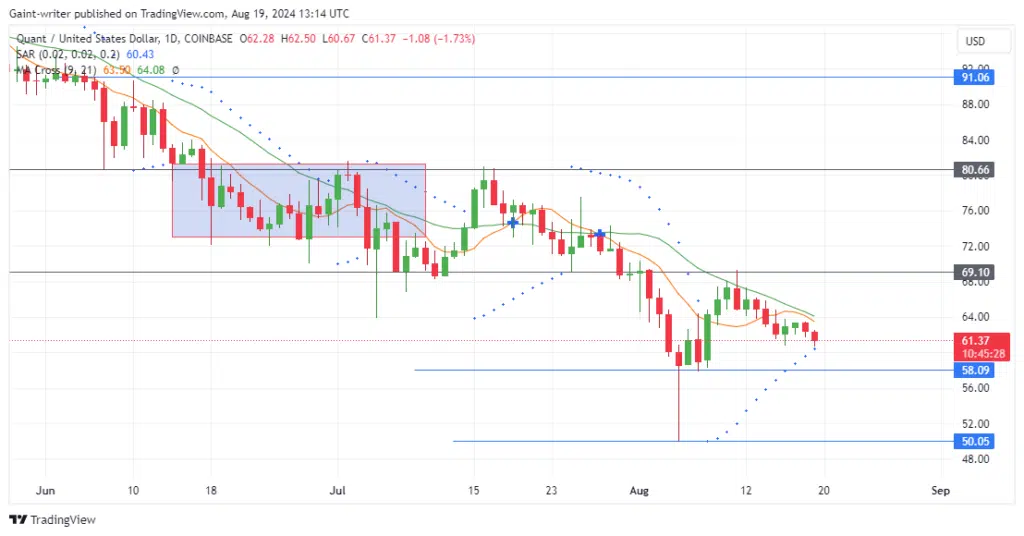
Quant Price Forecast: QNTUSD Outlook
Bears are opening more orders to drive prices lower, capitalizing on the strong selling pressure this month. After breaking through the $70.00 significant area, sellers expanded their influence, creating a surge of volatility that pushed prices down to the $50.00 area.
Quant buyers briefly intervened, lifting prices back to the $70.00 area. However, in the past two weeks, sellers have reasserted their control, maintaining the downward drift as they target a return to the $58.00 key level.
The Parabolic SAR (Stop and Reverse) indicator is rising in opposition to the bearish trend, suggesting potential for a reversal. However, the Moving Average Crossing indicator still favors sellers, reinforcing a bearish outlook.
Quant Medium Term Trend: Bearish (4-Hour Chart)
In the short term, Quant’s price continues to trend lower. Sellers plan to extend this drift as the downward trend remains strong.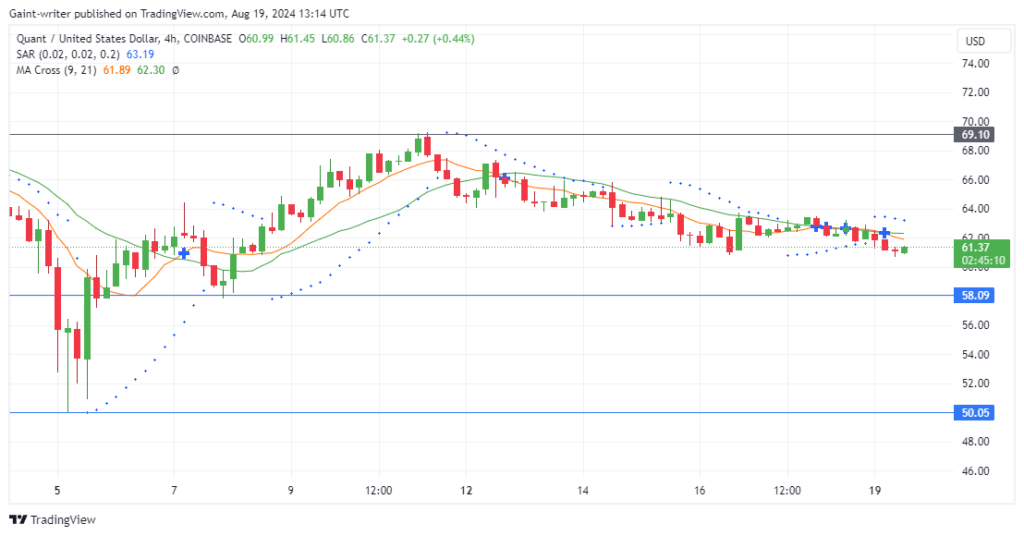
Make money without lifting your fingers: Start using a world-class auto trading solution
How To Buy Lucky Block – Guide, Tips & Insights | Learn 2 Trade
Note: Learn2.trade is not a financial advisor. Do your research before investing your funds in any financial asset, product, or event. We are not responsible for your investment results.
- Broker
- Min Deposit
- Score
- Visit Broker

- Award-winning Cryptocurrency trading platform
- $100 minimum deposit,
- FCA & Cysec regulated

- 20% welcome bonus of upto $10,000
- Minimum deposit $100
- Verify your account before the bonus is credited
- Fund Moneta Markets account with a minimum of $250
- Opt in using the form to claim your 50% deposit bonus
Learn to Trade
Never Miss A Trade Again

Signal Notification
Real-time signal notifications whenever a signal is opened, closes or Updated

Get Alerts
Immediate alerts to your email and mobile phone.

Entry Price Levels
Entry price level for every signal Just choose one of our Top Brokers in the list above to get all this free.