
Lucky Block – Guide, Tips & Insights | Learn 2 Trade Price Forecast – Expert Analysis & Trading Tips | Learn 2 Trade – Expert Analysis & Trading Tips | Learn 2 Trade – August 19th
The Lucky Block – Guide, Tips & Insights | Learn 2 Trade price forecast indicates that buyers will continue pushing towards the $0.00002500 key zone.
LBLOCKUSD Long Term Trend: Bullish (1-Day Chart)
Key Levels
Support Levels: $0.00001360, $0.00001470
Resistance Levels: $0.00002500, $0.00002100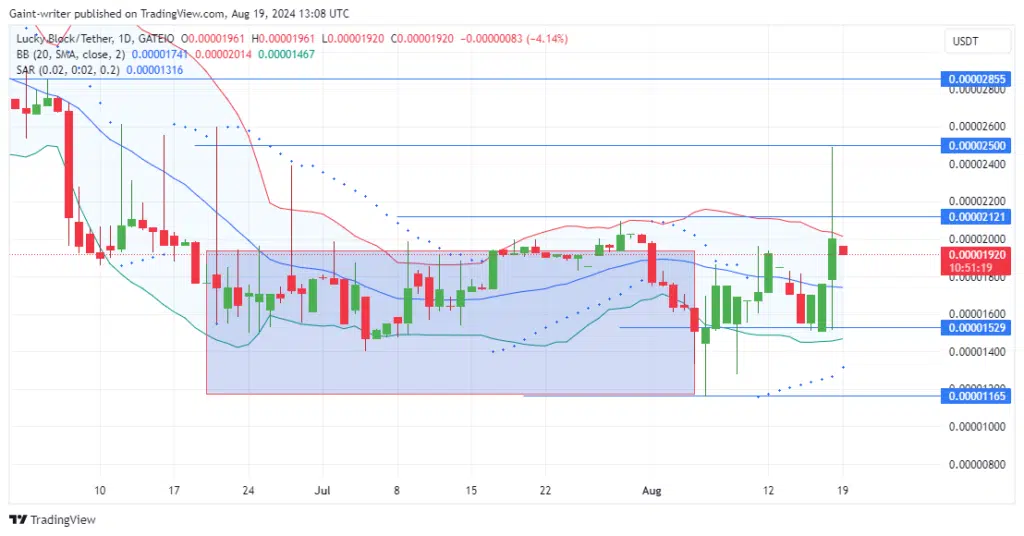
Lucky Block – Guide, Tips & Insights | Learn 2 Trade Price Forecast – Expert Analysis & Trading Tips | Learn 2 Trade – Expert Analysis & Trading Tips | Learn 2 Trade: LBLOCKUSD Outlook
Although the LBLOCK price has since retreated from the $0.00002500 level, buyers have now paused, waiting for an opportunity to build stronger momentum. Over the past few months, market volatility has been confined within the $0.00002100 and $0.00001520 levels.
The Bollinger Band indicator on the daily chart reflects market strength, with buyers showing signs of potential expansion. Despite current selling pressure, the bulls remain poised to make stronger attempts to push the price higher.
Market volatility remains high, and the Parabolic SAR (Stop and Reverse) indicator is supporting the bulls, boosting their confidence to break through current levels.
Lucky Block – Guide, Tips & Insights | Learn 2 Trade Medium Term Trend: Bullish (4-Hour Chart)
In the shorter timeframe, buyers remain optimistic about another strong breakout. Both the Bollinger Bands and the Parabolic SAR indicator position the bulls for further expansion.
How To Buy Lucky Block – Guide, Tips & Insights | Learn 2 Trade
Note: Learn2.trade is not a financial advisor. Do your research before investing your funds in any financial asset, product, or event. We are not responsible for your investment results.
- Broker
- Min Deposit
- Score
- Visit Broker

- Award-winning Cryptocurrency trading platform
- $100 minimum deposit,
- FCA & Cysec regulated

- 20% welcome bonus of upto $10,000
- Minimum deposit $100
- Verify your account before the bonus is credited


- Fund Moneta Markets account with a minimum of $250
- Opt in using the form to claim your 50% deposit bonus


