Quant Market Forecast – February 22
The Quant market forecast is for the price to continue to crank between significant price levels in anticipation of a bullish breakout.
Quant Long-Term Trend: Bullish (1-Day Chart)
Key Levels:
Zones of supply: $155.70, $227.70, $260.00
Zones of Demand: $101.30, $115.00, $125.25

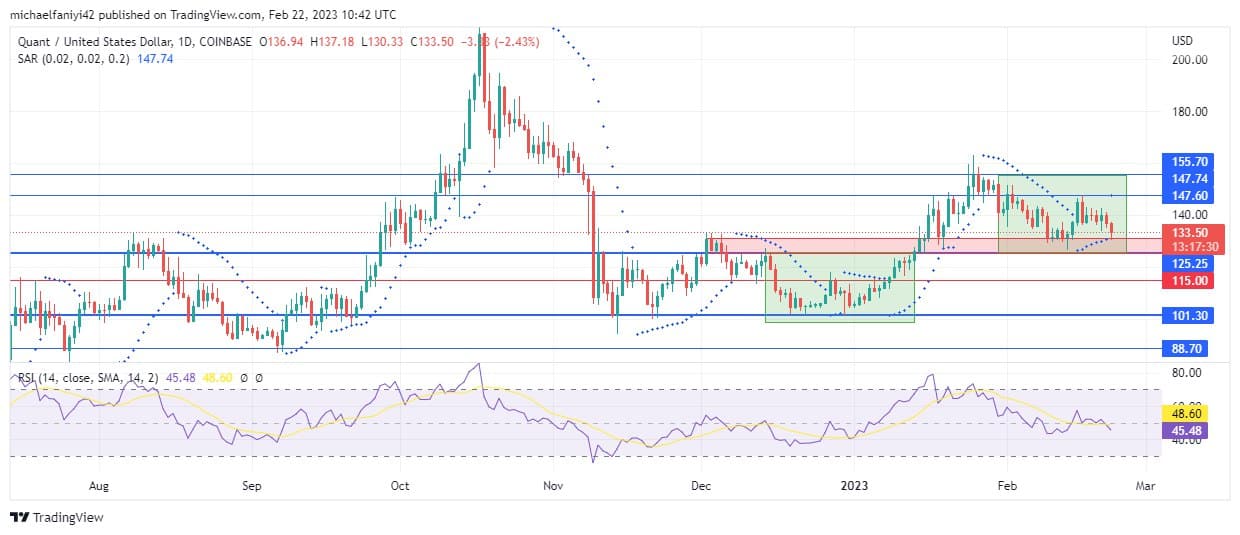
QNTUSD is now seen as ranging between significant levels. This comes after the buyers had expended their strength breaking out of the former consolidation zone. The buyers need to regroup and strengthen themselves to breach the $155.70 resistance level acting as a barrier. The new consolidation will help the buyers get reinforcement and gather momentum for a breakout.
Quant Price Forecast: QNT/USD Outlook
The Quant market is currently confined to a range of movements. The coin initially fails to breach the $155.70 resistance immediately. As a result, the price sank lower toward the support for reinforcement.
However, on the second rise, the price has been blocked again, showing an increase in the activities of the sellers. Nevertheless, the buyers are determined to regain control of the market through consolidation.
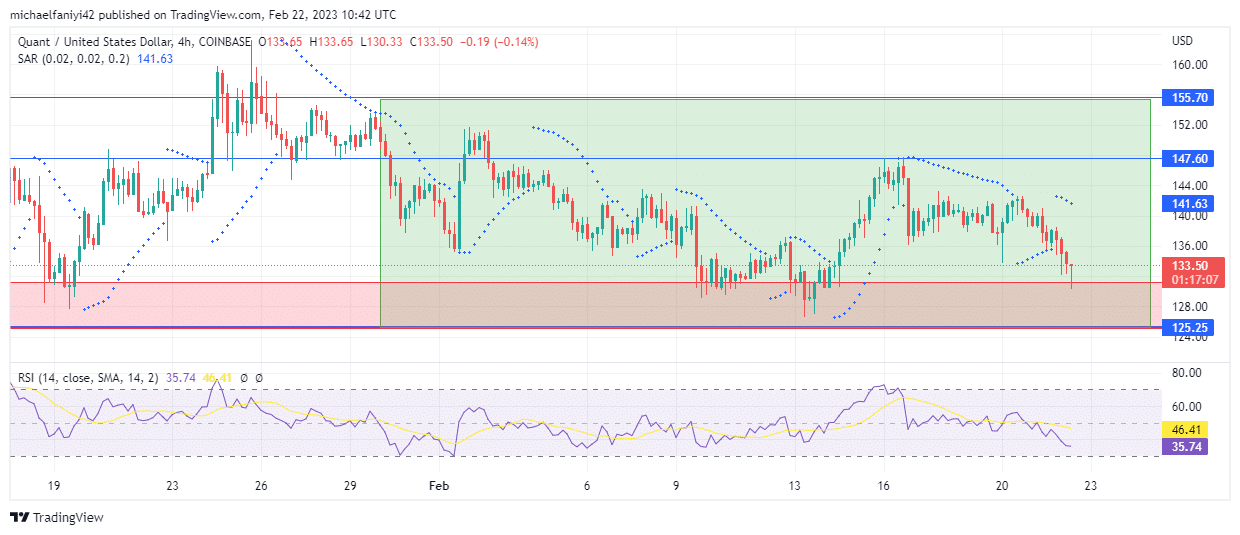
The price is now cranking between the $147.60 supply and the $125.25 support level. To this end, the Parabolic SAR (Stop and Reverse) dots are alternating around the candlesticks on the daily chart.
QNT/USD Medium-Term Trend: Bullish (4-hour chart)
A single dot can be seen above the latest candle on the daily chart to confirm the drop of the price in consolidation. However, on the 4-hour chart, more dots are lined up above the candlesticks to ensure the drop back to the support level as the price continues ranging.

The RSI (Relative Strength Index) line on the daily chart has also plunged from an overbought status and is currently fluctuating around the mid-line of the RSI chart. Meanwhile, on the 4-hour chart, the RSI line is now closer to the oversold region border even as the price draws closer to the support level.
Place winning Quant trades with us. Get QNT here
Note: Learn2.trade is not a financial advisor. Do your research before investing your funds in any financial asset or presented product or event. We are not responsible for your investing results.
- Broker
- Min Deposit
- Score
- Visit Broker
- Award-winning Cryptocurrency trading platform
- $100 minimum deposit,
- FCA & Cysec regulated
- 20% welcome bonus of upto $10,000
- Minimum deposit $100
- Verify your account before the bonus is credited
- Fund Moneta Markets account with a minimum of $250
- Opt in using the form to claim your 50% deposit bonus
Learn to Trade
Never Miss A Trade Again

Signal Notification
Real-time signal notifications whenever a signal is opened, closes or Updated

Get Alerts
Immediate alerts to your email and mobile phone.

Entry Price Levels
Entry price level for every signal Just choose one of our Top Brokers in the list above to get all this free.


