Don’t invest unless you’re prepared to lose all the money you invest. This is a high-risk investment and you are unlikely to be protected if something goes wrong. Take 2 minutes to learn more
Quant Market Prediction – July 1st
The Quant market prediction shows buyers actively making a solid push, aiming to break out above the $80.000 key level.
QNTUSD Long Term Trend: Bearish (1-Day Chart)
Key Levels
Supply Zones: $110.000, $120.000
Demand Zones: $72.000, $81.000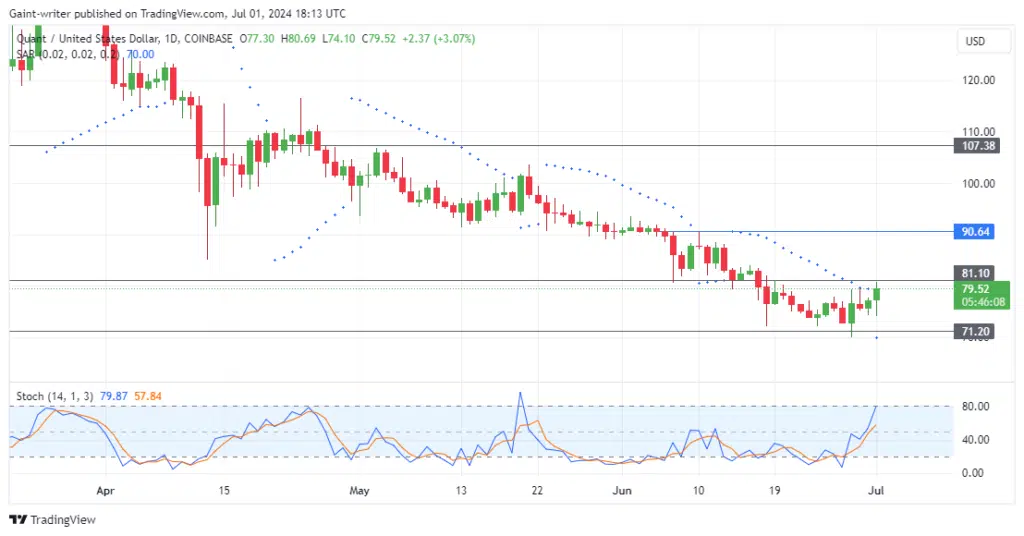
Quant Market Prediction: QNTUSD Anticipation
The QNTUSD price has been on a downward trajectory since the first quarter of the year, with bears dominating for almost half the year. The buyers have only managed a few recovery attempts during this period. In June, the sell-side traders pushed the price below the $80.000 key area.
However, if the current reversal can rise above this key zone, it could open the door for more buyers to enter the market. The technical indicators support the buyers, with the Parabolic SAR (Stop and Reverse) indicator now signaling a reversal.
The Stochastic Oscillator is also racing upward, indicating that the buyers are solidifying their strength. Crypto signals providers closely monitor these indicators to provide timely insights for traders.
QNTUSD Medium Term Trend: Bullish (4-hour Chart)
On the 4-hour chart, the QNTUSD pair continues its upward movement. As the buyers remain active, the Stochastic Oscillator and Parabolic SAR indicators suggest a potential breakout.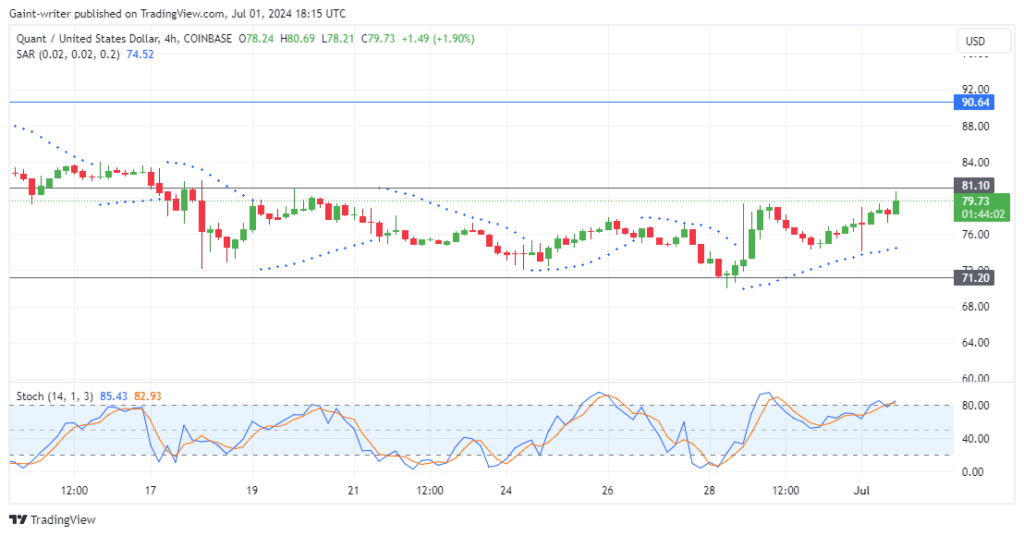
How To Buy Lucky Block – Guide, Tips & Insights | Learn 2 Trade
Note: Learn2.trade is not a financial advisor. Do your research before investing your funds in any financial asset, product, or event. We are not responsible for your investment results.
- Broker
- Min Deposit
- Score
- Visit Broker

- Award-winning Cryptocurrency trading platform
- $100 minimum deposit,
- FCA & Cysec regulated

- 20% welcome bonus of upto $10,000
- Minimum deposit $100
- Verify your account before the bonus is credited
- Fund Moneta Markets account with a minimum of $250
- Opt in using the form to claim your 50% deposit bonus
Learn to Trade
Never Miss A Trade Again

Signal Notification
Real-time signal notifications whenever a signal is opened, closes or Updated

Get Alerts
Immediate alerts to your email and mobile phone.

Entry Price Levels
Entry price level for every signal Just choose one of our Top Brokers in the list above to get all this free.