
Lucky Block Price Forecast – Expert Analysis & Trading Tips | Learn 2 Trade – Expert Analysis & Trading Tips | Learn 2 Trade: July 2nd
The Lucky Block price forecast shows the ongoing battle between buyers and sellers in the crypto market as bulls persist in their momentum.
LBLOCKUSD Long Term Trend: Bearish (1-Day Chart)
Key Levels
Support Levels: $0.000019700, $0.000030020
Resistance Levels: $0.000014800, $0.000025950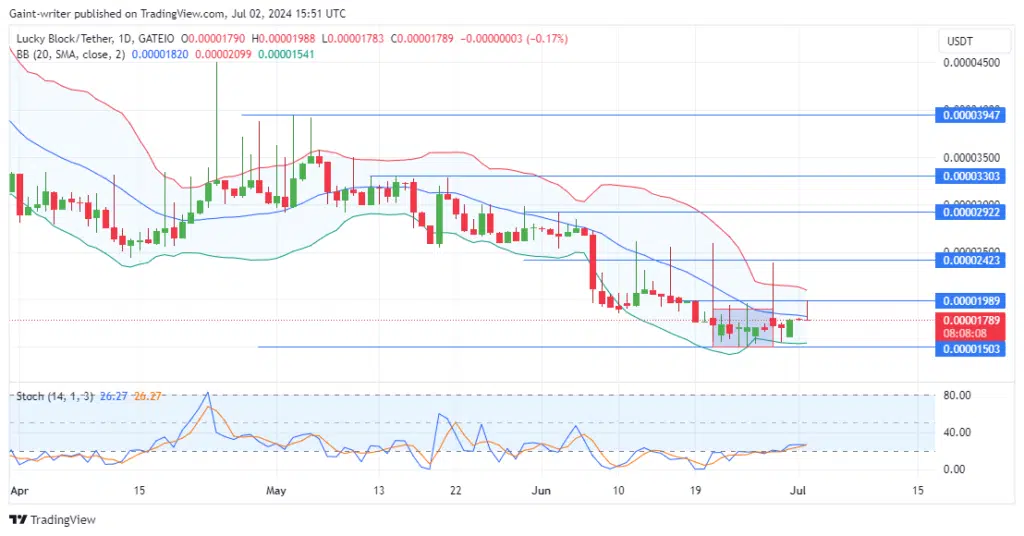
Lucky Block Price Forecast – Expert Analysis & Trading Tips | Learn 2 Trade – Expert Analysis & Trading Tips | Learn 2 Trade: LBLOCKUSD Outlook
The market is currently in a state of consolidation as the two sides battle for control. The buyers’ strong willingness to reverse the downtrend is evident in their recent efforts, which have kept the price from breaching the significant $0.000015000 level.
The buyers’ recent trading above the middle level of the Bollinger Band, despite the current selling pressure, suggests that they are not ready to surrender. This move, coupled with the Stochastic Oscillator’s signal wave in buy motion, indicates that the buyers still have the potential to push the price forward.
The Bollinger Band, a widely used technical indicator, serves as a dynamic support and resistance level. A breakout above the upper band could signal a strong bullish sentiment and the potential for further gains. Meanwhile, the Stochastic Oscillator is currently in a buy signal, further reinforcing the buyers’ case. Crypto signals providers are closely monitoring these indicators for trading opportunities.
LBLOCKUSD Medium Term Trend: Bullish (4-hour Chart)
In a shorter timeframe, the crypto market appears to be in a state of accumulation, with low volatility. This presents an opportunity for the buyers to regain their strength and mount a more decisive push for a breakout.
How To Buy Lucky Block
Note: Learn2.trade is not a financial advisor. Do your research before investing your funds in any financial asset, product, or event. We are not responsible for your investment results.


